[Cilium] (Observability) Hubble, Prometheus, Grafana
들어가며
이번에는 Hubble, Prometheus, Grafana 등을 이용하여 Cilium의 관측성(Observability)에 대해 살펴보겠습니다.
실습 환경 구성
- 실습 환경 소개
실습 환경은 지난주와 거의 유사합니다. 단, 파드 IP 대역이 10.244.0.0/16에서 172.20.0.0/16으로 변경되었습니다.
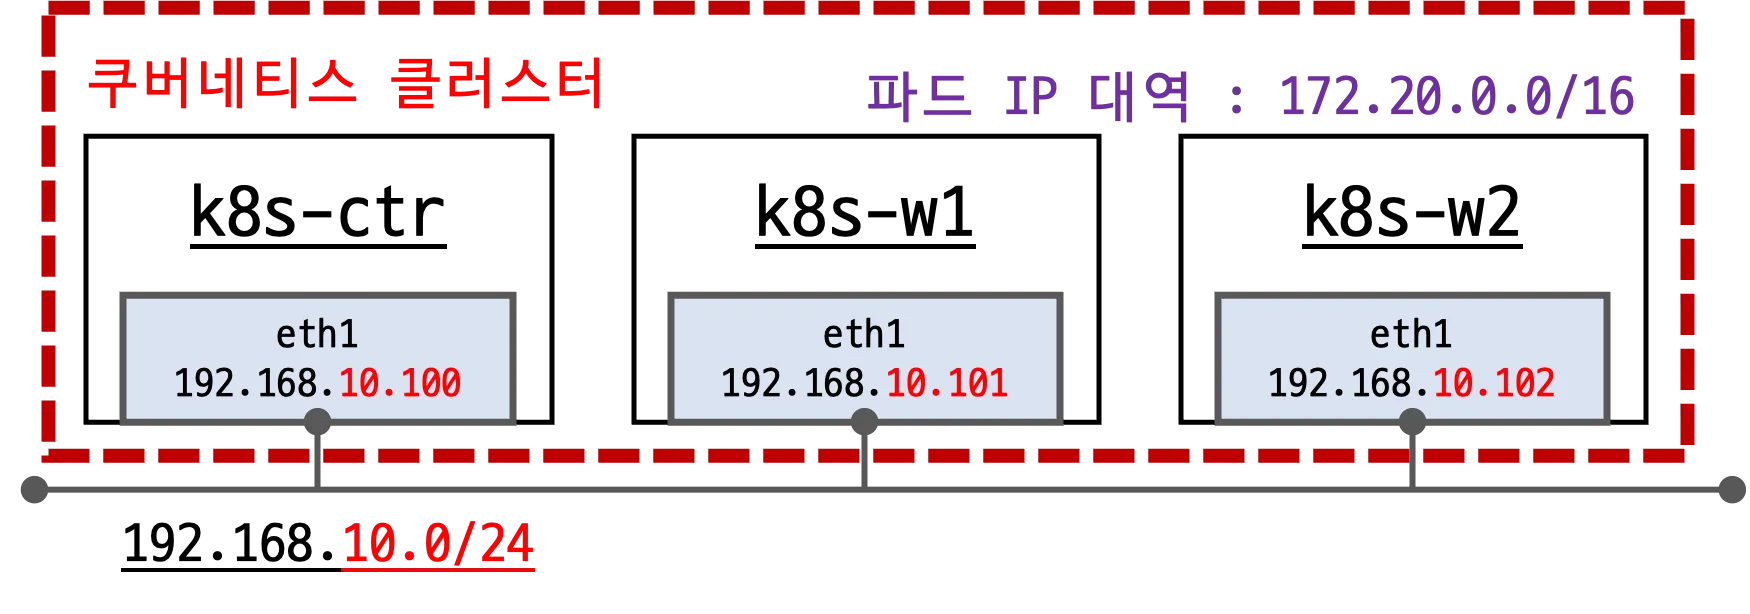
- 배포 가상 머신은 컨트롤플레인인 k8s-ctr, 워커노드 k8s-w1, k8s-w2로 구성되어 있습니다.
- eth0 : 10.0.2.15 (모든 노드가 동일)
- eth1 : 192.168.10.100~102
- 초기 프로비저닝시
kubeadm init과join을 실행하여 클러스터를 구성하며, 이번에는 Cilium CNI가 설치된 상태로 배포됩니다.
실습 환경 배포 파일 작성
Vagrantfile
- 가상머신을 정의하고 부팅시 실행할 프로비저닝 설정을 합니다.
# Variables
K8SV = '1.33.2-1.1' # Kubernetes Version : apt list -a kubelet , ex) 1.32.5-1.1
CONTAINERDV = '1.7.27-1' # Containerd Version : apt list -a containerd.io , ex) 1.6.33-1
CILIUMV = '1.17.6' # Cilium CNI Version : https://github.com/cilium/cilium/tags
N = 2 # max number of worker nodes

# Base Image  https://portal.cloud.hashicorp.com/vagrant/discover/bento/ubuntu-24.04
BOX_IMAGE = "bento/ubuntu-24.04"
BOX_VERSION = "202502.21.0"

Vagrant.configure("2") do |config|
  #-ControlPlane Node
  config.vm.define "k8s-ctr" do |subconfig|
    subconfig.vm.box = BOX_IMAGE

    subconfig.vm.box_version = BOX_VERSION
    subconfig.vm.provider "virtualbox" do |vb|
      vb.customize ["modifyvm", :id, "--groups", "/Cilium-Lab"]
      vb.customize ["modifyvm", :id, "--nicpromisc2", "allow-all"]
      vb.name = "k8s-ctr"
      vb.cpus = 2
      vb.memory = 2048
      vb.linked_clone = true
    end
    subconfig.vm.host_name = "k8s-ctr"
    subconfig.vm.network "private_network", ip: "192.168.10.100"
    subconfig.vm.network "forwarded_port", guest: 22, host: 60000, auto_correct: true, id: "ssh"
    subconfig.vm.synced_folder "./", "/vagrant", disabled: true
    subconfig.vm.provision "shell", path: "init_cfg.sh", args: [ K8SV, CONTAINERDV ]
    subconfig.vm.provision "shell", path: "k8s-ctr.sh", args: [ N, CILIUMV ]
  end

  #-Worker Nodes Subnet1
  (1..N).each do |i|
    config.vm.define "k8s-w#{i}" do |subconfig|
      subconfig.vm.box = BOX_IMAGE
      subconfig.vm.box_version = BOX_VERSION
      subconfig.vm.provider "virtualbox" do |vb|
        vb.customize ["modifyvm", :id, "--groups", "/Cilium-Lab"]
        vb.customize ["modifyvm", :id, "--nicpromisc2", "allow-all"]
        vb.name = "k8s-w#{i}"
        vb.cpus = 2
        vb.memory = 1536
        vb.linked_clone = true
      end
      subconfig.vm.host_name = "k8s-w#{i}"
      subconfig.vm.network "private_network", ip: "192.168.10.10#{i}"
      subconfig.vm.network "forwarded_port", guest: 22, host: "6000#{i}", auto_correct: true, id: "ssh"
      subconfig.vm.synced_folder "./", "/vagrant", disabled: true
      subconfig.vm.provision "shell", path: "init_cfg.sh", args: [ K8SV, CONTAINERDV]
      subconfig.vm.provision "shell", path: "k8s-w.sh"
    end
  end
end
init_cfg.sh
- 프로비저닝시 vagrant가 실행할 초기 설정 스크립트입니다. arguments로 Kubernetes 버전과 Containerd 버전등을 받아서 설치합니다.
#!/usr/bin/env bash

echo ">>>> Initial Config Start <<<<"

echo "[TASK 1] Setting Profile & Bashrc"
echo 'alias vi=vim' >> /etc/profile
echo "sudo su -" >> /home/vagrant/.bashrc
ln -sf /usr/share/zoneinfo/Asia/Seoul /etc/localtime # Change Timezone

echo "[TASK 2] Disable AppArmor"
systemctl stop ufw && systemctl disable ufw >/dev/null 2>&1
systemctl stop apparmor && systemctl disable apparmor >/dev/null 2>&1

echo "[TASK 3] Disable and turn off SWAP"
swapoff -a && sed -i '/swap/s/^/#/' /etc/fstab

echo "[TASK 4] Install Packages"
apt update -qq >/dev/null 2>&1
apt-get install apt-transport-https ca-certificates curl gpg -y -qq >/dev/null 2>&1

# Download the public signing key for the Kubernetes package repositories.
mkdir -p -m 755 /etc/apt/keyrings
K8SMMV=$(echo $1 | sed -En 's/^([0-9]+\.[0-9]+)\..*/\1/p')
curl -fsSL https://pkgs.k8s.io/core:/stable:/v$K8SMMV/deb/Release.key | sudo gpg --dearmor -o /etc/apt/keyrings/kubernetes-apt-keyring.gpg
echo "deb [signed-by=/etc/apt/keyrings/kubernetes-apt-keyring.gpg] https://pkgs.k8s.io/core:/stable:/v$K8SMMV/deb/ /" >> /etc/apt/sources.list.d/kubernetes.list
curl -fsSL https://download.docker.com/linux/ubuntu/gpg -o /etc/apt/keyrings/docker.asc
echo "deb [arch=$(dpkg --print-architecture) signed-by=/etc/apt/keyrings/docker.asc] https://download.docker.com/linux/ubuntu $(. /etc/os-release && echo "$VERSION_CODENAME") stable" | tee /etc/apt/sources.list.d/docker.list > /dev/null

# packets traversing the bridge are processed by iptables for filtering
echo 1 > /proc/sys/net/ipv4/ip_forward
echo "net.ipv4.ip_forward = 1" >> /etc/sysctl.d/k8s.conf

# enable br_netfilter for iptables
modprobe br_netfilter
modprobe overlay
echo "br_netfilter" >> /etc/modules-load.d/k8s.conf
echo "overlay" >> /etc/modules-load.d/k8s.conf

echo "[TASK 5] Install Kubernetes components (kubeadm, kubelet and kubectl)"
# Update the apt package index, install kubelet, kubeadm and kubectl, and pin their version
apt update >/dev/null 2>&1

# apt list -a kubelet ; apt list -a containerd.io
apt-get install -y kubelet=$1 kubectl=$1 kubeadm=$1 containerd.io=$2 >/dev/null 2>&1
apt-mark hold kubelet kubeadm kubectl >/dev/null 2>&1

# containerd configure to default and cgroup managed by systemd
containerd config default > /etc/containerd/config.toml
sed -i 's/SystemdCgroup = false/SystemdCgroup = true/g' /etc/containerd/config.toml

# avoid WARN&ERRO(default endpoints) when crictl run
cat <<EOF > /etc/crictl.yaml
runtime-endpoint: unix:///run/containerd/containerd.sock
image-endpoint: unix:///run/containerd/containerd.sock
EOF

# ready to install for k8s
systemctl restart containerd && systemctl enable containerd
systemctl enable --now kubelet

echo "[TASK 6] Install Packages & Helm"
export DEBIAN_FRONTEND=noninteractive
apt-get install -y bridge-utils sshpass net-tools conntrack ngrep tcpdump ipset arping wireguard jq tree bash-completion unzip kubecolor termshark >/dev/null 2>&1
curl -s https://raw.githubusercontent.com/helm/helm/master/scripts/get-helm-3 | bash >/dev/null 2>&1

echo ">>>> Initial Config End <<<<"
k8s-ctr.sh
-
kubeadm init으로 컨트롤플레인을 설정하고, Cilium CNI를 설치합니다. 또한 편의를 위한k,kc등의 alias를 설정합니다.
#!/usr/bin/env bash

echo ">>>> K8S Controlplane config Start <<<<"

echo "[TASK 1] Initial Kubernetes"
curl --silent -o /root/kubeadm-init-ctr-config.yaml https://raw.githubusercontent.com/gasida/vagrant-lab/refs/heads/main/cilium-study/2w/kubeadm-init-ctr-config.yaml
kubeadm init --config="/root/kubeadm-init-ctr-config.yaml" --skip-phases=addon/kube-proxy  >/dev/null 2>&1


echo "[TASK 2] Setting kube config file"
mkdir -p /root/.kube
cp -i /etc/kubernetes/admin.conf /root/.kube/config
chown $(id -u):$(id -g) /root/.kube/config


echo "[TASK 3] Source the completion"
echo 'source <(kubectl completion bash)' >> /etc/profile
echo 'source <(kubeadm completion bash)' >> /etc/profile


echo "[TASK 4] Alias kubectl to k"
echo 'alias k=kubectl' >> /etc/profile
echo 'alias kc=kubecolor' >> /etc/profile
echo 'complete -F __start_kubectl k' >> /etc/profile


echo "[TASK 5] Install Kubectx & Kubens"
git clone https://github.com/ahmetb/kubectx /opt/kubectx >/dev/null 2>&1
ln -s /opt/kubectx/kubens /usr/local/bin/kubens
ln -s /opt/kubectx/kubectx /usr/local/bin/kubectx


echo "[TASK 6] Install Kubeps & Setting PS1"
git clone https://github.com/jonmosco/kube-ps1.git /root/kube-ps1 >/dev/null 2>&1
cat <<"EOT" >> /root/.bash_profile
source /root/kube-ps1/kube-ps1.sh
KUBE_PS1_SYMBOL_ENABLE=true
function get_cluster_short() {
  echo "$1" | cut -d . -f1
}
KUBE_PS1_CLUSTER_FUNCTION=get_cluster_short
KUBE_PS1_SUFFIX=') '
PS1='$(kube_ps1)'$PS1
EOT
kubectl config rename-context "kubernetes-admin@kubernetes" "HomeLab" >/dev/null 2>&1


echo "[TASK 7] Install Cilium CNI"
NODEIP=$(ip -4 addr show eth1 | grep -oP '(?<=inet\s)\d+(\.\d+){3}')
helm repo add cilium https://helm.cilium.io/ >/dev/null 2>&1
helm repo update >/dev/null 2>&1
helm install cilium cilium/cilium --version $2 --namespace kube-system \
--set k8sServiceHost=192.168.10.100 --set k8sServicePort=6443 \
--set ipam.mode="cluster-pool" --set ipam.operator.clusterPoolIPv4PodCIDRList={"172.20.0.0/16"} --set ipv4NativeRoutingCIDR=172.20.0.0/16 \
--set routingMode=native --set autoDirectNodeRoutes=true --set endpointRoutes.enabled=true \
--set kubeProxyReplacement=true --set bpf.masquerade=true --set installNoConntrackIptablesRules=true \
--set endpointHealthChecking.enabled=false --set healthChecking=false \
--set hubble.enabled=false --set operator.replicas=1 --set debug.enabled=true >/dev/null 2>&1


echo "[TASK 8] Install Cilium CLI"
CILIUM_CLI_VERSION=$(curl -s https://raw.githubusercontent.com/cilium/cilium-cli/main/stable.txt)
CLI_ARCH=amd64
if [ "$(uname -m)" = "aarch64" ]; then CLI_ARCH=arm64; fi
curl -L --fail --remote-name-all https://github.com/cilium/cilium-cli/releases/download/${CILIUM_CLI_VERSION}/cilium-linux-${CLI_ARCH}.tar.gz >/dev/null 2>&1
tar xzvfC cilium-linux-${CLI_ARCH}.tar.gz /usr/local/bin
rm cilium-linux-${CLI_ARCH}.tar.gz


echo "[TASK 9] local DNS with hosts file"
echo "192.168.10.100 k8s-ctr" >> /etc/hosts
for (( i=1; i<=$1; i++  )); do echo "192.168.10.10$i k8s-w$i" >> /etc/hosts; done


echo ">>>> K8S Controlplane Config End <<<<"
-
부가적으로
kubeadm-init-ctr-config.yaml파일은 다음과 같이 작성되어 있습니다.apiVersion: kubeadm.k8s.io/v1beta4 kind: InitConfiguration bootstrapTokens: - token: "123456.1234567890123456" ttl: "0s" usages: - signing - authentication localAPIEndpoint: advertiseAddress: "192.168.10.100" nodeRegistration: kubeletExtraArgs: - name: node-ip value: "192.168.10.100" criSocket: "unix:///run/containerd/containerd.sock" --- apiVersion: kubeadm.k8s.io/v1beta4 kind: ClusterConfiguration kubernetesVersion: v1.33.2 networking: podSubnet: "10.244.0.0/16" serviceSubnet: "10.96.0.0/16"
k8s-w.sh
- 워커노드에서
kubeadm join을 실행하여 컨트롤플레인에 조인합니다.
#!/usr/bin/env bash

echo ">>>> K8S Node config Start <<<<"

echo "[TASK 1] K8S Controlplane Join"
curl --silent -o /root/kubeadm-join-worker-config.yaml https://raw.githubusercontent.com/gasida/vagrant-lab/refs/heads/main/cilium-study/2w/kubeadm-join-worker-config.yaml
NODEIP=$(ip -4 addr show eth1 | grep -oP '(?<=inet\s)\d+(\.\d+){3}')
sed -i "s/NODE_IP_PLACEHOLDER/${NODEIP}/g" /root/kubeadm-join-worker-config.yaml
kubeadm join --config="/root/kubeadm-join-worker-config.yaml" > /dev/null 2>&1

echo ">>>> K8S Node config End <<<<"
-
kubeadm-join-worker-config.yaml파일은 다음과 같이 작성되어 있습니다.apiVersion: kubeadm.k8s.io/v1beta4 kind: JoinConfiguration discovery: bootstrapToken: token: "123456.1234567890123456" apiServerEndpoint: "192.168.10.100:6443" unsafeSkipCAVerification: true nodeRegistration: criSocket: "unix:///run/containerd/containerd.sock" kubeletExtraArgs: - name: node-ip value: "NODE_IP_PLACEHOLDER"
실습환경 배포
- 배포
$ vagrant up
- [k8s-ctr] 접속 후 기본 정보 확인
# k8s-ctr 접속
$ vagrant ssh k8s-ctr
---
#
$ cat /etc/hosts
# => 127.0.0.1 localhost
#    127.0.1.1 vagrant
#    ...
#    127.0.2.1 k8s-ctr k8s-ctr
#    192.168.10.100 k8s-ctr
#    192.168.10.101 k8s-w1
#    192.168.10.102 k8s-w2
$ sshpass -p 'vagrant' ssh -o StrictHostKeyChecking=no vagrant@k8s-w1 hostname
# => k8s-w1
$ sshpass -p 'vagrant' ssh -o StrictHostKeyChecking=no vagrant@k8s-w2 hostname
# => k8s-w2

#
$ ifconfig | grep -iEA1 'eth[0-9]:'
# => eth0: flags=4163<UP,BROADCAST,RUNNING,MULTICAST>  mtu 1500
#            inet 10.0.2.15  netmask 255.255.255.0  broadcast 10.0.2.255
#    --
#    eth1: flags=4163<UP,BROADCAST,RUNNING,MULTICAST>  mtu 1500
#            inet 192.168.10.100  netmask 255.255.255.0  broadcast 192.168.10.255

# 클러스터 정보 확인
$ kubectl cluster-info
$ kubectl cluster-info dump | grep -m 2 -E "cluster-cidr|service-cluster-ip-range"
# =>                             "--service-cluster-ip-range=10.96.0.0/16",
#                                "--cluster-cidr=10.244.0.0/16",
$ kubectl describe cm -n kube-system kubeadm-config
$ kubectl describe cm -n kube-system kubelet-config

# 노드 정보 : 상태, INTERNAL-IP 확인
$ kubectl get node -owide
# => NAME      STATUS   ROLES           AGE   VERSION   INTERNAL-IP      EXTERNAL-IP   OS-IMAGE             KERNEL-VERSION     CONTAINER-RUNTIME
#    k8s-ctr   Ready    control-plane   14m   v1.33.2   <span style="color: green;">192.168.10.100</span>   <none>        Ubuntu 24.04.2 LTS   6.8.0-53-generic   containerd://1.7.27
#    k8s-w1    Ready    <none>          11m   v1.33.2   <span style="color: green;">192.168.10.101</span>   <none>        Ubuntu 24.04.2 LTS   6.8.0-53-generic   containerd://1.7.27
#    k8s-w2    Ready    <none>          10m   v1.33.2   <span style="color: green;">192.168.10.102</span>   <none>        Ubuntu 24.04.2 LTS   6.8.0-53-generic   containerd://1.7.27

# 노드별 kubeadm-flags.env 정보 확인
$ cat /var/lib/kubelet/kubeadm-flags.env
# => KUBELET_KUBEADM_ARGS="--container-runtime-endpoint=unix:///run/containerd/containerd.sock --node-ip=192.168.10.100 --pod-infra-container-image=registry.k8s.io/pause:3.10"
$ for i in w1 w2 ; do echo ">> node : k8s-$i <<"; sshpass -p 'vagrant' ssh vagrant@k8s-$i cat /var/lib/kubelet/kubeadm-flags.env ; echo; done

# 파드 정보 : 상태, 파드 IP 확인
$ kubectl get nodes -o jsonpath='{range .items[*]}{.metadata.name}{"\t"}{.spec.podCIDR}{"\n"}{end}'
# => k8s-ctr 10.244.0.0/24
#    k8s-w1  10.244.1.0/24
#    k8s-w2  10.244.2.0/24
$ kubectl get ciliumnode -o json | grep podCIDRs -A2
# =>                     "podCIDRs": [ "172.20.0.0/24" ],
#    --
#                        "podCIDRs": [ "172.20.1.0/24" ],
#    --
#                        "podCIDRs": [ "172.20.2.0/24" ],
$ kubectl get pod -A -owide
# => NAMESPACE     NAME                               READY   STATUS    RESTARTS   AGE   IP               NODE      NOMINATED NODE   READINESS GATES
#    kube-system   <span style="color: green;">cilium-2rgdx</span>                       1/1     Running   0          15m   192.168.10.100   k8s-ctr   <none>           <none>
#    kube-system   <span style="color: green;">cilium-envoy-q97fq</span>                 1/1     Running   0          12m   192.168.10.102   k8s-w2    <none>           <none>
#    kube-system   <span style="color: green;">cilium-envoy-xzxd6</span>                 1/1     Running   0          13m   192.168.10.101   k8s-w1    <none>           <none>
#    kube-system   <span style="color: green;">cilium-envoy-zzzw5</span>                 1/1     Running   0          15m   192.168.10.100   k8s-ctr   <none>           <none>
#    kube-system   <span style="color: green;">cilium-fdqhq</span>                       1/1     Running   0          12m   192.168.10.102   k8s-w2    <none>           <none>
#    kube-system   <span style="color: green;">cilium-kv67c</span>                       1/1     Running   0          13m   192.168.10.101   k8s-w1    <none>           <none>
#    kube-system   <span style="color: green;">cilium-operator-5bc66f5b9b-xps5x</span>   1/1     Running   0          15m   192.168.10.100   k8s-ctr   <none>           <none>
#    kube-system   coredns-674b8bbfcf-4h2lt           1/1     <span style="color: green;">Running</span>   0          15m   172.20.0.233     k8s-ctr   <none>           <none>
#    kube-system   coredns-674b8bbfcf-7m82r           1/1     <span style="color: green;">Running</span>   0          15m   172.20.0.167     k8s-ctr   <none>           <none>
#    kube-system   etcd-k8s-ctr                       1/1     Running   0          16m   192.168.10.100   k8s-ctr   <none>           <none>
#    kube-system   kube-apiserver-k8s-ctr             1/1     Running   0          16m   192.168.10.100   k8s-ctr   <none>           <none>
#    kube-system   kube-controller-manager-k8s-ctr    1/1     Running   0          16m   192.168.10.100   k8s-ctr   <none>           <none>
#    kube-system   kube-scheduler-k8s-ctr             1/1     Running   0          16m   192.168.10.100   k8s-ctr   <none>           <none>
# <span style="color: green;">👉 cilium CNI가 설치되어있고, CNI가 설치되었기 때문에 coredns가 Running 상태로 시작됨을 알 수 있습니다.</span>
# <span style="color: green;">👉 또한 kube-proxy가 설치되지 않았고, Cilium이 kube-proxy를 대체하고 있음을 알 수 있습니다.</span>

# iptables 확인
$ iptables-save
$ iptables -t nat -S
$ iptables -t filter -S
$ iptables -t mangle -S
- [k8s-ctr] cilium 설치 정보 확인
# cilium 상태 확인
$ which cilium
# => /usr/local/bin/cilium
$ cilium status
# =>     /¯¯\
#     /¯¯\__/¯¯\    Cilium:             OK
#     \__/¯¯\__/    Operator:           OK
#     /¯¯\__/¯¯\    Envoy DaemonSet:    OK
#     \__/¯¯\__/    Hubble Relay:       disabled
#        \__/       ClusterMesh:        disabled
#
#    DaemonSet              cilium                   Desired: 3, Ready: 3/3, Available: 3/3
#    DaemonSet              cilium-envoy             Desired: 3, Ready: 3/3, Available: 3/3
#    Deployment             cilium-operator          Desired: 1, Ready: 1/1, Available: 1/1
#    Containers:            cilium                   Running: 3
#                           cilium-envoy             Running: 3
#                           cilium-operator          Running: 1
#                           clustermesh-apiserver
#                           hubble-relay
#    Cluster Pods:          2/2 managed by Cilium
#    Helm chart version:    1.17.6
#    Image versions         cilium             quay.io/cilium/cilium:v1.17.6@sha256:544de3d4fed7acba72758413812780a4972d47c39035f2a06d6145d8644a3353: 3
#                           cilium-envoy       quay.io/cilium/cilium-envoy:v1.33.4-1752151664-7c2edb0b44cf95f326d628b837fcdd845102ba68@sha256:318eff387835ca2717baab42a84f35a83a5f9e7d519253df87269f80b9ff0171: 3
#                           cilium-operator    quay.io/cilium/operator-generic:v1.17.6@sha256:91ac3bf7be7bed30e90218f219d4f3062a63377689ee7246062fa0cc3839d096: 1
$ cilium config view
$ kubectl get cm -n kube-system cilium-config -o json | jq

#
$ kubectl exec -n kube-system -c cilium-agent -it ds/cilium -- cilium-dbg config
$ kubectl exec -n kube-system -c cilium-agent -it ds/cilium -- cilium-dbg status --verbose
$ kubectl exec -n kube-system -c cilium-agent -it ds/cilium -- cilium-dbg metrics list

#
$ kubectl get ciliumendpoints -A

# monitor
$ kubectl exec -n kube-system -c cilium-agent -it ds/cilium -- cilium-dbg monitor
$ kubectl exec -n kube-system -c cilium-agent -it ds/cilium -- cilium-dbg monitor -v
$ kubectl exec -n kube-system -c cilium-agent -it ds/cilium -- cilium-dbg monitor -v -v

## Filter for only the events related to endpoint
$ kubectl exec -n kube-system -c cilium-agent -it ds/cilium -- cilium-dbg monitor --related-to=<id>

## Show notifications only for dropped packet events
$ kubectl exec -n kube-system -c cilium-agent -it ds/cilium -- cilium-dbg monitor --type drop

## Don’t dissect packet payload, display payload in hex information
$ kubectl exec -n kube-system -c cilium-agent -it ds/cilium -- cilium-dbg monitor -v -v --hex

## Layer7
$ kubectl exec -n kube-system -c cilium-agent -it ds/cilium -- cilium-dbg monitor -v --type l7
Cilium Agent 단축키 지정
- [Cilium] 실습 환경 구성 및 Cilium 설치의 Cilium CMD Cheatsheet를 참고하여 환경변수와 alias를 지정합니다.
# cilium 파드 이름
$ export CILIUMPOD0=$(kubectl get -l k8s-app=cilium pods -n kube-system --field-selector spec.nodeName=k8s-ctr -o jsonpath='{.items[0].metadata.name}')
$ export CILIUMPOD1=$(kubectl get -l k8s-app=cilium pods -n kube-system --field-selector spec.nodeName=k8s-w1  -o jsonpath='{.items[0].metadata.name}')
$ export CILIUMPOD2=$(kubectl get -l k8s-app=cilium pods -n kube-system --field-selector spec.nodeName=k8s-w2  -o jsonpath='{.items[0].metadata.name}')
$ echo $CILIUMPOD0 $CILIUMPOD1 $CILIUMPOD2
# => cilium-5kc8d cilium-w9st8 cilium-l8lm7

# 단축키(alias) 지정
$ alias c0="kubectl exec -it $CILIUMPOD0 -n kube-system -c cilium-agent -- cilium"
$ alias c1="kubectl exec -it $CILIUMPOD1 -n kube-system -c cilium-agent -- cilium"
$ alias c2="kubectl exec -it $CILIUMPOD2 -n kube-system -c cilium-agent -- cilium"

$ alias c0bpf="kubectl exec -it $CILIUMPOD0 -n kube-system -c cilium-agent -- bpftool"
$ alias c1bpf="kubectl exec -it $CILIUMPOD1 -n kube-system -c cilium-agent -- bpftool"
$ alias c2bpf="kubectl exec -it $CILIUMPOD2 -n kube-system -c cilium-agent -- bpftool"
Network Observability with Hubble
Hubble 소개

- Hubble은 Cilium과 eBPF를 기반으로 구축된 완전히 분산된 네트워킹 및 보안 관측 가능성 플랫폼입니다. 서비스의 통신 및 동작뿐만 아니라 네트워킹 인프라에 대한 깊은 가시성을 투명하게 제공합니다.
- Hubble은 오버헤드를 최소화 하는 동적 접근 방식을 제공하며, 다중 클러스터(ClusterMesh) 환경에서도 노드 수준, 컨트롤러 수준 또는 클러스터 간 가시성을 제공할 수 있습니다.
- Hubble API는 Cilium 에이전트가 실행되는 개별 노드에서 작동합니다. Hubble CLI는 로컬 유닉스 도메인 소켓을 통해 제공되는 Hubble API를 쿼리할 수 있습니다.
- Hubble Relay를 배포하면 클러스터 메시 시나리오에서 전체 클러스터 또는 여러 클러스터에 대한 가시성을 제공합니다. 이 모드에서는 Hubble CLI를 Hubble Relay에 연결하여 모든 노드에서 수집된 이벤트를 쿼리하거나, Hubble UI를 통해 Hubble 데이터에 접근할 수 있습니다.
- 서비스 의존성 및 통신 그래프를 시각화 할 수 있습니다.
- 네트워크 정책 모니터링 및 알림을 제공하여 네트워크 통신 실패 등을 모니터링 하고 원인을 파악하는데 도움을 줍니다.
- 애플리케이션 성능 모니터링을 통해 서비스 간의 지연 시간, 오류율 등을 측정하고 분석할 수 있습니다.
- 보안 정책 모니터링을 통해 네트워크 정책 위반, 의심스러운 트래픽 등을 감지하고 대응할 수 있습니다.
Hubble Observability 설치
- 관련 문서 : docs
- 설치 전 확인
#
$ cilium status
# => ...
#     \__/¯¯\__/    Hubble Relay:       disabled
#    ...
#    Containers:            cilium                   Running: 3
#                           cilium-envoy             Running: 3
#                           cilium-operator          Running: 1
#                           clustermesh-apiserver
#                           hubble-relay
#    ...
$ cilium config view | grep -i hubble
# => enable-hubble                                     false
# <span style="color: green;">👉 현재 Hubble이 설치되어 있지 않습니다.</span>

$ kubectl get cm -n kube-system cilium-config -o json | jq
# => ...
#        "enable-hubble": "false",
#
$ kubectl get secret -n kube-system | grep -iE 'cilium-ca|hubble'
# => (공백)
$ ss -tnlp | grep -iE 'cilium|hubble' | tee before.txt
# => LISTEN 0      4096        127.0.0.1:37303      0.0.0.0:*    users:(("cilium-agent",pid=2853,fd=42))
#    LISTEN 0      4096        127.0.0.1:9234       0.0.0.0:*    users:(("cilium-operator",pid=2153,fd=9))
#    LISTEN 0      4096          0.0.0.0:9964       0.0.0.0:*    users:(("cilium-envoy",pid=2224,fd=25))
#    LISTEN 0      4096          0.0.0.0:9964       0.0.0.0:*    users:(("cilium-envoy",pid=2224,fd=24))
#    LISTEN 0      4096        127.0.0.1:9890       0.0.0.0:*    users:(("cilium-agent",pid=2853,fd=6))
#    LISTEN 0      4096        127.0.0.1:9891       0.0.0.0:*    users:(("cilium-operator",pid=2153,fd=6))
#    LISTEN 0      4096        127.0.0.1:9878       0.0.0.0:*    users:(("cilium-envoy",pid=2224,fd=27))
#    LISTEN 0      4096        127.0.0.1:9878       0.0.0.0:*    users:(("cilium-envoy",pid=2224,fd=26))
#    LISTEN 0      4096        127.0.0.1:9879       0.0.0.0:*    users:(("cilium-agent",pid=2853,fd=51))
#    LISTEN 0      4096                *:9963             *:*    users:(("cilium-operator",pid=2153,fd=7))
- Hubble 설치
# 설치방안 1 : hubble 활성화, 메트릭 설정 등등
$ helm upgrade cilium cilium/cilium --namespace kube-system --reuse-values \
  --set hubble.enabled=true \
  --set hubble.relay.enabled=true \
  --set hubble.ui.enabled=true \
  --set hubble.ui.service.type=NodePort \
  --set hubble.ui.service.nodePort=31234 \
  --set hubble.export.static.enabled=true \
  --set hubble.export.static.filePath=/var/run/cilium/hubble/events.log \
  --set prometheus.enabled=true \
  --set operator.prometheus.enabled=true \
  --set hubble.metrics.enableOpenMetrics=true \
  --set hubble.metrics.enabled="{dns,drop,tcp,flow,port-distribution,icmp,httpV2:exemplars=true;labelsContext=source_ip\,source_namespace\,source_workload\,destination_ip\,destination_namespace\,destination_workload\,traffic_direction}"
# => Release "cilium" has been upgraded. Happy Helming!
#    NAME: cilium
#    LAST DEPLOYED: Thu Jul 24 23:16:48 2025
#    NAMESPACE: kube-system
#    STATUS: deployed
#    REVISION: 2
#    TEST SUITE: None
#    NOTES:
#    You have successfully installed Cilium with Hubble Relay and Hubble UI.
#
#    Your release version is 1.17.6.

# 설치방안 2 : hubble 활성화
$ cilium hubble enable
$ cilium hubble enable --ui

# cilium status를 통한 hubble 설치 상태 확인
$ cilium status
# => ...
#     \__/¯¯\__/    Hubble Relay:       OK
#    ...
#    Deployment             hubble-relay             Desired: 1, Ready: 1/1, Available: 1/1
#    Deployment             hubble-ui                Desired: 1, Ready: 1/1, Available: 1/1
#    Containers:            hubble-relay             Running: 1
#                           hubble-ui                Running: 1

# hubble 관련 설정 정보 확인
$ cilium config view | grep -i hubble
# => enable-hubble                                     true
#    enable-hubble-open-metrics                        true
#    hubble-disable-tls                                false
#    hubble-export-allowlist
#    hubble-export-denylist
#    hubble-export-fieldmask
#    hubble-export-file-max-backups                    5
#    hubble-export-file-max-size-mb                    10
#    hubble-export-file-path                           /var/run/cilium/hubble/events.log
#    hubble-listen-address                             :4244
#    hubble-metrics                                    dns drop tcp flow port-distribution icmp httpV2:exemplars=true;labelsContext=source_ip,source_namespace,source_workload,destination_ip,destination_namespace,destination_workload,traffic_direction
#    hubble-metrics-server                             :9965
#    hubble-metrics-server-enable-tls                  false
#    hubble-socket-path                                /var/run/cilium/hubble.sock
#    hubble-tls-cert-file                              /var/lib/cilium/tls/hubble/server.crt
#    hubble-tls-client-ca-files                        /var/lib/cilium/tls/hubble/client-ca.crt
#    hubble-tls-key-file                               /var/lib/cilium/tls/hubble/server.key

# config map에서 hubble 관련 설정 정보 확인
$ kubectl get cm -n kube-system cilium-config -o json | grep -i hubble
# =>         "enable-hubble": "true",
#            "enable-hubble-open-metrics": "true",
#            "hubble-disable-tls": "false",
#            "hubble-export-allowlist": "",
#    ...

# hubble 관련 secret 정보 확인
$ kubectl get secret -n kube-system | grep -iE 'cilium-ca|hubble'
# => cilium-ca                      Opaque                          2      4m57s
#    hubble-relay-client-certs      kubernetes.io/tls               3      4m57s
#    hubble-server-certs            kubernetes.io/tls               3      4m57s

# TCP 포트 4244를 모든 cilium을 실행하는 노드에서 열어야 할 필요가 있음
$ ss -tnlp | grep -iE 'cilium|hubble' | tee after.txt
# => LISTEN 0      4096        127.0.0.1:37303      0.0.0.0:*    users:(("cilium-agent",pid=4891,fd=52))
#    LISTEN 0      4096        127.0.0.1:9234       0.0.0.0:*    users:(("cilium-operator",pid=2153,fd=9))
#    LISTEN 0      4096          0.0.0.0:9964       0.0.0.0:*    users:(("cilium-envoy",pid=2224,fd=25))
#    LISTEN 0      4096          0.0.0.0:9964       0.0.0.0:*    users:(("cilium-envoy",pid=2224,fd=24))
#    LISTEN 0      4096        127.0.0.1:9890       0.0.0.0:*    users:(("cilium-agent",pid=4891,fd=6))
#    LISTEN 0      4096        127.0.0.1:9891       0.0.0.0:*    users:(("cilium-operator",pid=2153,fd=6))
#    LISTEN 0      4096        127.0.0.1:9878       0.0.0.0:*    users:(("cilium-envoy",pid=2224,fd=27))
#    LISTEN 0      4096        127.0.0.1:9878       0.0.0.0:*    users:(("cilium-envoy",pid=2224,fd=26))
#    LISTEN 0      4096        127.0.0.1:9879       0.0.0.0:*    users:(("cilium-agent",pid=4891,fd=62))
#    LISTEN 0      4096                *:4244             *:*    users:(("cilium-agent",pid=4891,fd=55))
#    LISTEN 0      4096                *:9965             *:*    users:(("cilium-agent",pid=4891,fd=34))
#    LISTEN 0      4096                *:9962             *:*    users:(("cilium-agent",pid=4891,fd=7))
#    LISTEN 0      4096                *:9963             *:*    users:(("cilium-operator",pid=2153,fd=7))

# Hubble 실행 전과 후의 리스닝 포트 변경확인
$ vi -d before.txt after.txt
# =>   LISTEN 0      4096        127.0.0.1:37303      0.0.0.0:|  LISTEN 0      4096        127.0.0.1:37303      0.0.0.0:
#      LISTEN 0      4096        127.0.0.1:9234       0.0.0.0:|  LISTEN 0      4096        127.0.0.1:9234       0.0.0.0:
#      LISTEN 0      4096          0.0.0.0:9964       0.0.0.0:|  LISTEN 0      4096          0.0.0.0:9964       0.0.0.0:
#      LISTEN 0      4096          0.0.0.0:9964       0.0.0.0:|  LISTEN 0      4096          0.0.0.0:9964       0.0.0.0:
#      LISTEN 0      4096        127.0.0.1:9890       0.0.0.0:|  LISTEN 0      4096        127.0.0.1:9890       0.0.0.0:
#      LISTEN 0      4096        127.0.0.1:9891       0.0.0.0:|  LISTEN 0      4096        127.0.0.1:9891       0.0.0.0:
#      LISTEN 0      4096        127.0.0.1:9878       0.0.0.0:|  LISTEN 0      4096        127.0.0.1:9878       0.0.0.0:
#      LISTEN 0      4096        127.0.0.1:9878       0.0.0.0:|  LISTEN 0      4096        127.0.0.1:9878       0.0.0.0:
#      LISTEN 0      4096        127.0.0.1:9879       0.0.0.0:|  LISTEN 0      4096        127.0.0.1:9879       0.0.0.0:
#      -------------------------------------------------------|  <span style="background-color: green; color: #fff;">LISTEN 0      4096                *:4244             *:</span>
#      -------------------------------------------------------|  <span style="background-color: green; color: #fff;">LISTEN 0      4096                *:9965             *:</span>
#      -------------------------------------------------------|  <span style="background-color: green; color: #fff;">LISTEN 0      4096                *:9962             *:</span>
#      LISTEN 0      4096                *:9963             *:|  LISTEN 0      4096                *:9963             *:

# 각 노드의 4244 포트 오픈 확인
$ for i in w1 w2 ; do echo ">> node : k8s-$i <<"; sshpass -p 'vagrant' ssh vagrant@k8s-$i sudo ss -tnlp |grep 4244 ; echo; done
# => >> node : k8s-w1 <<
#    LISTEN 0      4096               *:4244             *:*    users:(("cilium-agent",pid=3528,fd=50))
#    >> node : k8s-w2 <<
#    LISTEN 0      4096               *:4244             *:*    users:(("cilium-agent",pid=3268,fd=46))

# Hubble Relay Pod 확인
$ kubectl get pod -n kube-system -l k8s-app=hubble-relay
# => NAME                           READY   STATUS    RESTARTS   AGE
#    hubble-relay-5dcd46f5c-n4zfx   1/1     Running   0          12m

$ kc describe pod -n kube-system -l k8s-app=hubble-relay
# => Name:             hubble-relay-5dcd46f5c-n4zfx
#    Namespace:        kube-system
#    Service Account:  hubble-relay
#    Labels:           app.kubernetes.io/name=hubble-relay
#                      app.kubernetes.io/part-of=cilium
#                      k8s-app=hubble-relay
#    ...
#        Image:         quay.io/cilium/hubble-relay:v1.17.6@sha256:7d17ec10b3d37341c18ca56165b2f29a715cb8ee81311fd07088d8bf68c01e60
#    ...

$ kc get svc,ep -n kube-system hubble-relay
# => NAME                   TYPE        CLUSTER-IP      EXTERNAL-IP   PORT(S)   AGE
#    service/hubble-relay   ClusterIP   10.96.207.219   <none>        80/TCP    14m
#
#    NAME                     ENDPOINTS           AGE
#    endpoints/hubble-relay   172.20.2.214:4245   14m

# hubble-relay 는 hubble-peer 의 서비스(ClusterIP :443)을 통해 모든 노드의 :4244에 요청 가져올 수 있음
$ kubectl get cm -n kube-system
# => NAME                                                   DATA   AGE
#    cilium-config                                          158    23h
#    cilium-envoy-config                                    1      23h
#    ...
#    hubble-relay-config                                    1      17m
#    hubble-ui-nginx                                        1      17m

$ kubectl describe cm -n kube-system hubble-relay-config
# => ...
#    cluster-name: default
#    peer-service: "hubble-peer.kube-system.svc.cluster.local.:443"
#    listen-address: :4245
#    ...

# Hubble Peer Pod 확인
$ kubectl get svc,ep -n kube-system hubble-peer
# => NAME                  TYPE        CLUSTER-IP     EXTERNAL-IP   PORT(S)   AGE
#    service/hubble-peer   ClusterIP   10.96.12.202   <none>        443/TCP   21m
#
#    NAME                    ENDPOINTS                                                     AGE
#    endpoints/hubble-peer   192.168.10.100:4244,192.168.10.101:4244,192.168.10.102:4244   21m

#
$ kc describe pod -n kube-system -l k8s-app=hubble-ui
# => ...
#      frontend:
#        Port:           8081/TCP
#        ...
#      backend:
#        Port:           8090/TCP
#        ...

$ kc describe cm -n kube-system hubble-ui-nginx
# => ...
#    nginx.conf:
#    ----
#    server {
#        listen       8081;
#        listen       [::]:8081;
#        server_name  localhost;
#        root /app;
#        index index.html;
#        client_max_body_size 1G;
#
#        location / {
#            proxy_set_header Host $host;
#            proxy_set_header X-Real-IP $remote_addr;
#
#            location /api {
#                proxy_http_version 1.1;
#                proxy_pass_request_headers on;
#                proxy_pass http://127.0.0.1:8090;
#            }
#            location / {
#                # double `/index.html` is required here
#                try_files $uri $uri/ /index.html /index.html;
#            }
#
#            # Liveness probe
#            location /healthz {
#                access_log off;
#                add_header Content-Type text/plain;
#                return 200 'ok';
#            }
#        }
#    }
#    ...

#
$ kubectl get svc,ep -n kube-system hubble-ui
# => NAME                TYPE       CLUSTER-IP      EXTERNAL-IP   PORT(S)        AGE
#    service/hubble-ui   NodePort   10.96.183.249   <none>        80:31234/TCP   26m
#
#    NAME                  ENDPOINTS           AGE
#    endpoints/hubble-ui   172.20.1.189:8081   26m

# hubble ui 웹 접속 주소 확인
$ NODEIP=$(ip -4 addr show eth1 | grep -oP '(?<=inet\s)\d+(\.\d+){3}')
$ echo -e "http://$NODEIP:31234"
# => http://192.168.10.100:31234
-
Hubble ui 접속 테스트 -> 접속 후 kube-system 네임스페이스 선택
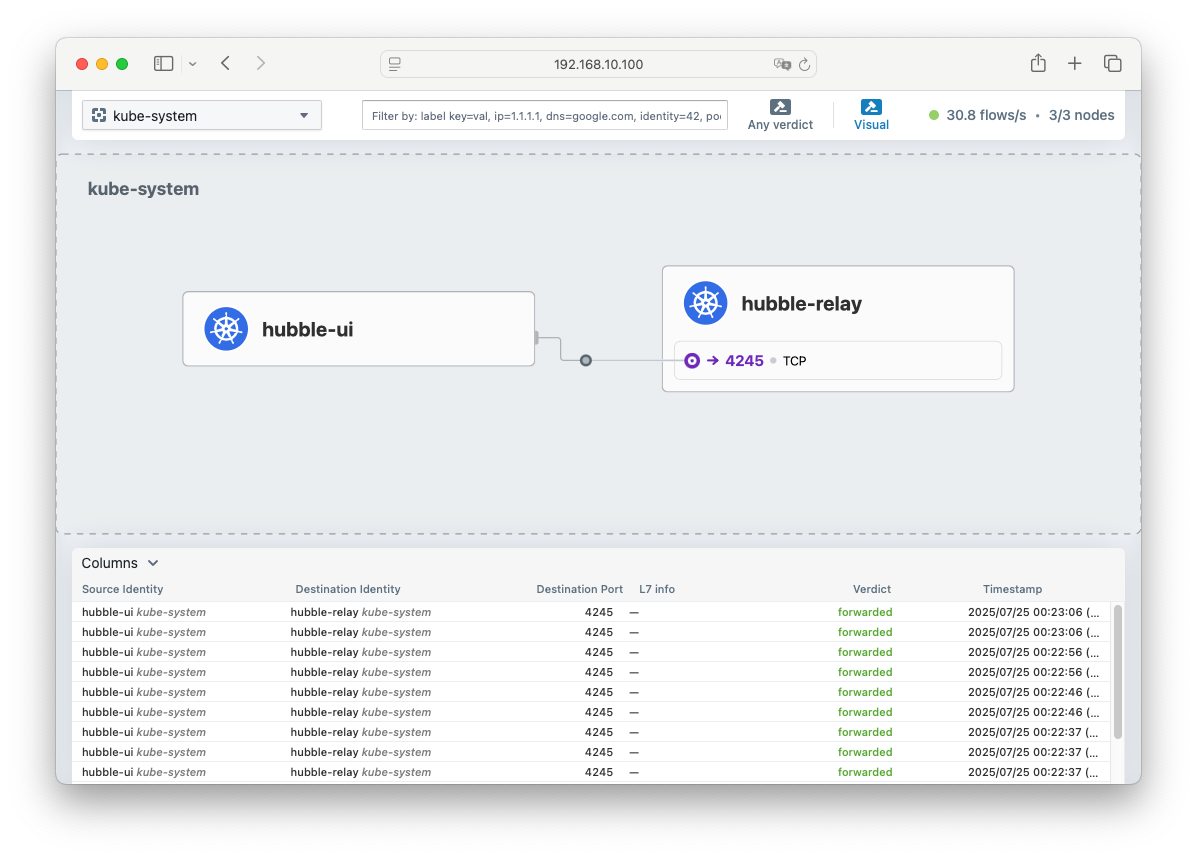
-
Hubble Client 설치 - docs
$ HUBBLE_VERSION=$(curl -s https://raw.githubusercontent.com/cilium/hubble/master/stable.txt)
$ HUBBLE_ARCH=amd64
$ if [ "$(uname -m)" = "aarch64" ]; then HUBBLE_ARCH=arm64; fi
$ curl -L --fail --remote-name-all https://github.com/cilium/hubble/releases/download/$HUBBLE_VERSION/hubble-linux-${HUBBLE_ARCH}.tar.gz{,.sha256sum}
$ sudo tar xzvfC hubble-linux-${HUBBLE_ARCH}.tar.gz /usr/local/bin
# => hubble
$ which hubble
# => /usr/local/bin/hubble
$ hubble status
# => failed getting status: rpc error: code = Unavailable desc = connection error: desc = "transport: Error while dialing: dial tcp 127.0.0.1:4245: connect: connection refused"
- Hubble client를 설치했지만 기본적으로 localhost를 통해 연결을 시도하기 때문에 연결이 되지 않습니다. 포트포워딩을 통해 hubble relay를 통해 연결할 수 있도록 설정합니다.
#
$ cilium hubble port-forward&
# =>   Hubble Relay is available at 127.0.0.1:4245
# <span style="color: green;">👉 4245 포트가 localhost로 포워딩 되었습니다.</span>

$ ss -tnlp | grep 4245
# => LISTEN 0      4096        127.0.0.1:4245       0.0.0.0:*    users:(("cilium",pid=3402,fd=7))

# Now you can validate that you can access the Hubble API via the installed CLI
$ hubble status
# => Healthcheck (via localhost:4245): Ok
#    Current/Max Flows: 12,285/12,285 (100.00%)
#    Flows/s: 31.55
#    Connected Nodes: 3/3

# hubble (api) server 기본 접속 주소 확인
$ hubble config view
# => ...
#    port-forward-port: "4245"
#    server: localhost:4245
#    ...
Star Wars Demo를 통한 Hubble/UI 체험
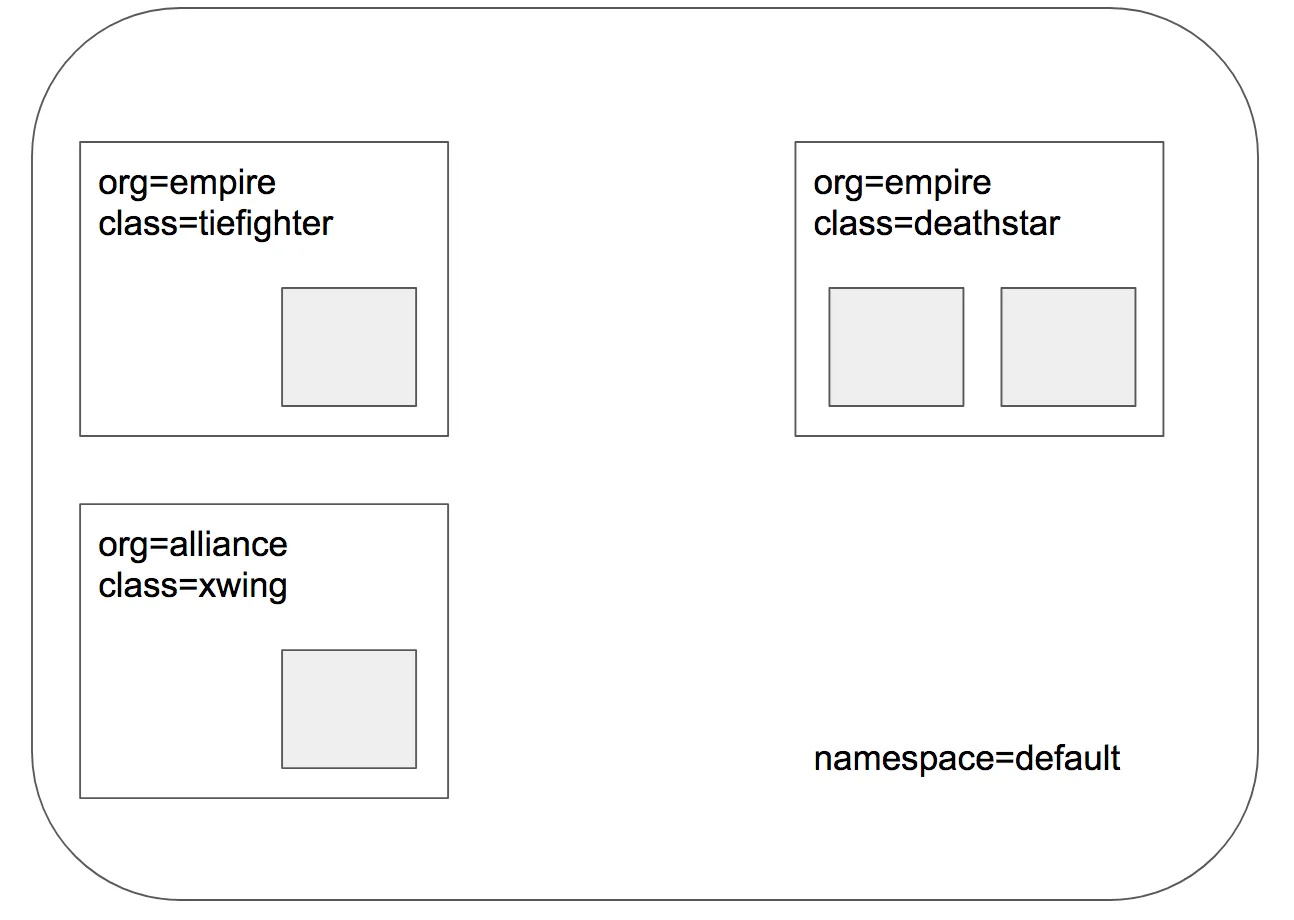 목표 배포상태
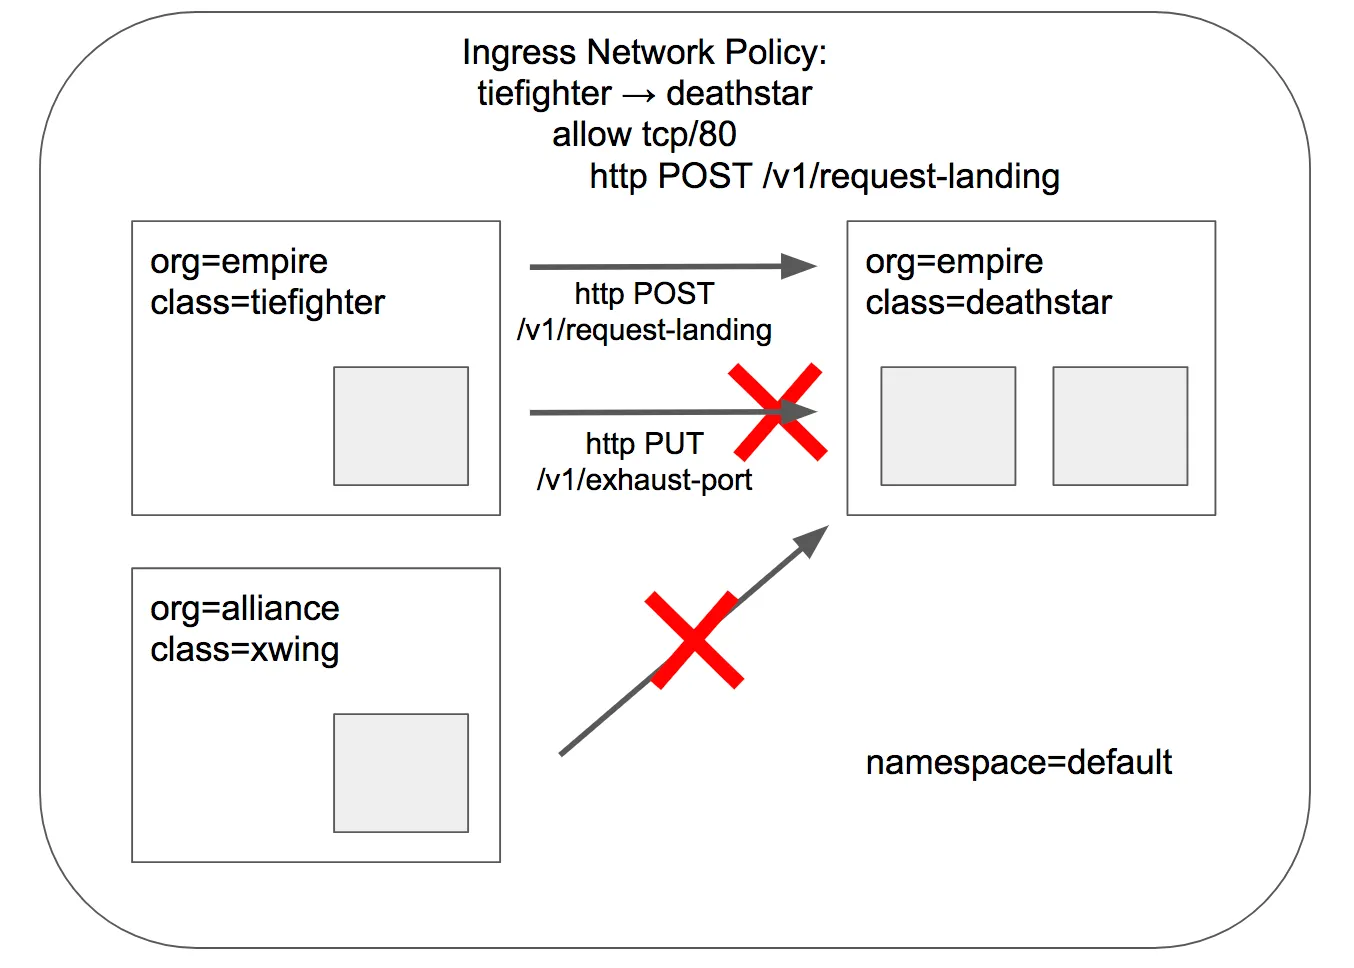
- 스타워즈에서 영감을 받은 예제이며, deathstar, xwing, tiefighter의 세가지 마이크로 서비스로 구성되어 있습니다.
- deathstar는 80포트에서 http 웹서비스를 실행하며, 두 개의 pod 복제본에 걸쳐 로드 밸런싱을 수행합니다.
- deathstar 서비스는 empire의 우주선에 착륙 서비스를 제공하여 착륙 포트 요청을 할 수 있도록 합니다.
- tiefighter는 일반적인 제국 우주선의 착륙 요청 클라이언트 서비스를 나타내며 xwing은 연합 우주선의 착륙 요청 클라이언트 서비스를 나타냅니다.
- deathstar 착륙 서비스에 대한 접근 제어를 위한 다양한 보안 정책을 테스트하기 위하여 구성되었습니다.
데모 애플리케이션 배포
#
$ kubectl apply -f https://raw.githubusercontent.com/cilium/cilium/1.17.6/examples/minikube/http-sw-app.yaml
# => service/deathstar created
#    deployment.apps/deathstar created
#    pod/tiefighter created
#    pod/xwing created

# 파드 라벨 labels 확인
$ kubectl get pod --show-labels
# => NAME                        READY   STATUS    RESTARTS   AGE   LABELS
#    deathstar-8c4c77fb7-5zqmp   1/1     Running   0          12h   app.kubernetes.io/name=deathstar,class=deathstar,org=empire,pod-template-hash=8c4c77fb7
#    deathstar-8c4c77fb7-h2rsh   1/1     Running   0          12h   app.kubernetes.io/name=deathstar,class=deathstar,org=empire,pod-template-hash=8c4c77fb7
#    tiefighter                  1/1     Running   0          12h   app.kubernetes.io/name=tiefighter,class=tiefighter,org=empire
#    xwing                       1/1     Running   0          12h   app.kubernetes.io/name=xwing,class=xwing,org=alliance

$ kubectl get deploy,svc,ep deathstar
# => NAME                        READY   UP-TO-DATE   AVAILABLE   AGE
#    deployment.apps/deathstar   2/2     2            2           12h
#
#    NAME                TYPE        CLUSTER-IP      EXTERNAL-IP   PORT(S)   AGE
#    service/deathstar   ClusterIP   10.96.153.126   <none>        80/TCP    12h
#
#    NAME                  ENDPOINTS                        AGE
#    endpoints/deathstar   172.20.1.67:80,172.20.2.251:80   12h

#
$ kubectl get ciliumendpoints.cilium.io -A
# => NAMESPACE     NAME                           SECURITY IDENTITY   ENDPOINT STATE   IPV4           IPV6
#    default       deathstar-8c4c77fb7-5zqmp      46219               ready            172.20.2.251
#    default       deathstar-8c4c77fb7-h2rsh      46219               ready            172.20.1.67
#    default       tiefighter                     50993               ready            172.20.2.254
#    default       xwing                          14847               ready            172.20.2.111
#    kube-system   coredns-674b8bbfcf-7m82r       30923               ready            172.20.0.134
#    kube-system   coredns-674b8bbfcf-dnc5n       30923               ready            172.20.1.13
#    kube-system   hubble-relay-5dcd46f5c-n4zfx   5844                ready            172.20.2.144
#    kube-system   hubble-ui-76d4965bb6-7mcft     14841               ready            172.20.1.30
$ kubectl get ciliumidentities.cilium.io
# => NAME    NAMESPACE     AGE
#    10901   default       12h
#    14841   kube-system   37h
#    14847   default       12h
#    30923   kube-system   2d13h
#    46219   default       12h
#    50993   default       12h
#    5844    kube-system   37h

# in a multi-node installation, only the ones running on the same node will be listed
# cilium 엔드포인트 목록 확인. 명령을 실행한 노드의 엔드포인트만 확인 가능합니다.
$ kubectl exec -it -n kube-system ds/cilium -c cilium-agent -- cilium endpoint list
# => ENDPOINT   POLICY (ingress)   POLICY (egress)   IDENTITY   LABELS (source:key[=value])                                                  IPv6   IPv4           STATUS
#               ENFORCEMENT        ENFORCEMENT
#    1332       Disabled           Disabled          1          k8s:node-role.kubernetes.io/control-plane                                                          ready
#                                                               k8s:node.kubernetes.io/exclude-from-external-load-balancers
#                                                               reserved:host
#    1814       Disabled           Disabled          30923      k8s:io.cilium.k8s.namespace.labels.kubernetes.io/metadata.name=kube-system          172.20.0.134   ready
#                                                               k8s:io.cilium.k8s.policy.cluster=default
#                                                               k8s:io.cilium.k8s.policy.serviceaccount=coredns
#                                                               k8s:io.kubernetes.pod.namespace=kube-system
#                                                               k8s:k8s-app=kube-dns
$ c0 endpoint list
# => ...
#    1814 Disabled Disabled 30923 k8s:io.cilium.k8s.namespace.labels.kubernetes.io/metadata.name=kube-system 172.20.0.134   ready
$ c1 endpoint list
# => ...
#    507  Disabled Disabled 46219 k8s:app.kubernetes.io/name=deathstar                                       172.20.1.67   ready
#    ...
#    966  Disabled Disabled 30923 k8s:io.cilium.k8s.namespace.labels.kubernetes.io/metadata.name=kube-system 172.20.1.13   ready
#    ...
#    1864 Disabled Disabled 14841 k8s:app.kubernetes.io/name=hubble-ui                                       172.20.1.30   ready
$ c2 endpoint list
# => ENDPOINT POLICY (ingress) POLICY (egress) IDENTITY LABELS (source:key[=value])                                                  IPv6   IPv4           STATUS
#             ENFORCEMENT      ENFORCEMENT
#    309      <span style="color: green;">Disabled</span>         <span style="color: green;">Disabled</span>        14847    k8s:app.kubernetes.io/name=xwing                                                    172.20.2.111   ready
#    721      <span style="color: green;">Disabled</span>         <span style="color: green;">Disabled</span>        50993    k8s:app.kubernetes.io/name=tiefighter                                               172.20.2.254   ready
#    1282     <span style="color: green;">Disabled</span>         <span style="color: green;">Disabled</span>        1        reserved:host                                                                                      ready
#    1391     <span style="color: green;">Disabled</span>         <span style="color: green;">Disabled</span>        46219    k8s:app.kubernetes.io/name=deathstar                                                172.20.2.251   ready
#                                                       <span style="color: green;">k8s:class=deathstar</span>
#                                                       k8s:io.cilium.k8s.namespace.labels.kubernetes.io/metadata.name=default
#                                                       k8s:io.cilium.k8s.policy.cluster=default
#                                                       k8s:io.cilium.k8s.policy.serviceaccount=default
#                                                       k8s:io.kubernetes.pod.namespace=default
#                                                       <span style="color: green;">k8s:org=empire</span>
#    3027     <span style="color: green;">Disabled</span>         <span style="color: green;">Disabled</span>        5844     k8s:app.kubernetes.io/name=hubble-relay                                             172.20.2.144   ready
# <span style="color: green;">👉 현재 ingress/egress 에 정책(Policy) 없음을 확인 할 수 있습니다. 또한 label을 통해 다양한 정보를 확인할 수 있습니다.</span>
현재 접근상태 확인
- deathstar 서비스의 관점에서는 org=empire 라벨이 있는 우주선만 착륙을 요청할 수 있습니다.
- 아직까지는 ingress/egress 정책이 없기 때문에 제국 우주선 뿐만 아니라 연합의 우주선 착륙 요청도 허용됩니다.
- 아래의 명령을 통해 확인해보겠습니다
# 아래 출력에서 xwing 와 tiefighter 의 IDENTITY 값을 확인합니다.
$ c1 endpoint list | grep -iE 'xwing|tiefighter|deathstar'
# => 507        Disabled           Disabled          <span style="color: green;">46219</span>      k8s:app.kubernetes.io/name=deathstar                                                172.20.1.67   ready
$ c2 endpoint list | grep -iE 'xwing|tiefighter|deathstar'
# => 309        Disabled           Disabled          <span style="color: green;">14847</span>      k8s:app.kubernetes.io/name=xwing                                                    172.20.2.111   ready
#    721        Disabled           Disabled          <span style="color: green;">50993</span>      k8s:app.kubernetes.io/name=tiefighter                                               172.20.2.254   ready
#    1391       Disabled           Disabled          <span style="color: green;">46219</span>      k8s:app.kubernetes.io/name=deathstar                                                172.20.2.251   ready
$ XWINGID=14847
$ TIEFIGHTERID=50993
$ DEATHSTARID=46219

# 모니터링 준비 : 터미널 3개, 단축키 설정
## 각각 monitor 확인
$ c0 monitor -v -v
$ c1 monitor -v -v
$ c2 monitor -v -v

# 모니터링 준비 : 터미널 1개
$ hubble observe -f

$ hubble observe -f --from-identity $XWINGID
$ hubble observe -f --protocol udp --from-identity $XWINGID
$ hubble observe -f --protocol tcp --from-identity $XWINGID

$ hubble observe -f --protocol tcp --from-identity $DEATHSTARID

# 호출 시도 1
$ kubectl exec xwing -- curl -s -XPOST deathstar.default.svc.cluster.local/v1/request-landing
$ while true; do kubectl exec xwing -- curl -s -XPOST deathstar.default.svc.cluster.local/v1/request-landing ; sleep 5 ; done

# 호출 시도 2
$ kubectl exec tiefighter -- curl -s -XPOST deathstar.default.svc.cluster.local/v1/request-landing
$ while true; do kubectl exec tiefighter -- curl -s -XPOST deathstar.default.svc.cluster.local/v1/request-landing ; sleep 5 ; done

## 모니터링
$ hubble observe -f --protocol tcp --from-identity $TIEFIGHTERID
$ hubble observe -f --protocol tcp --from-identity $DEATHSTARID
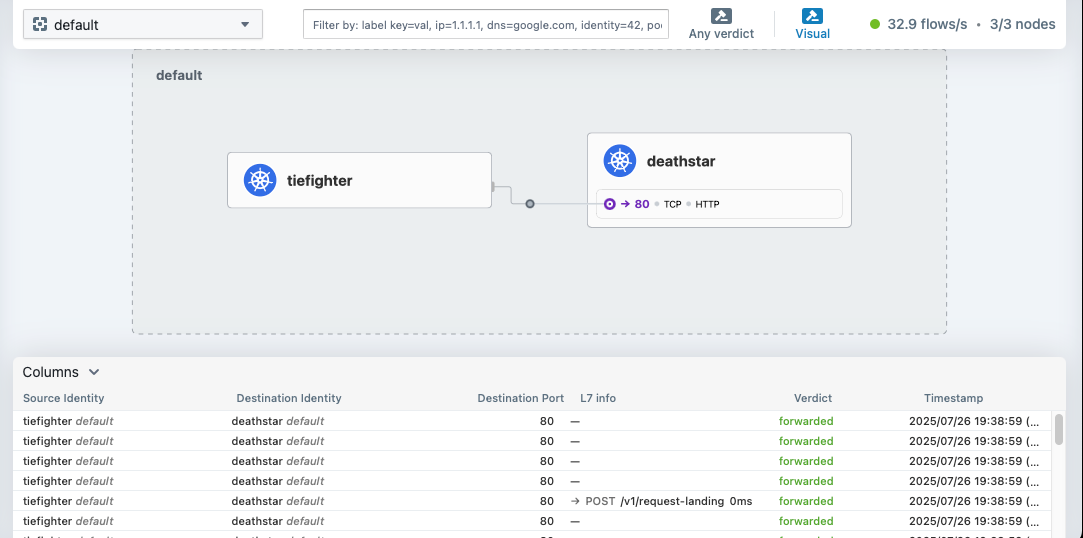
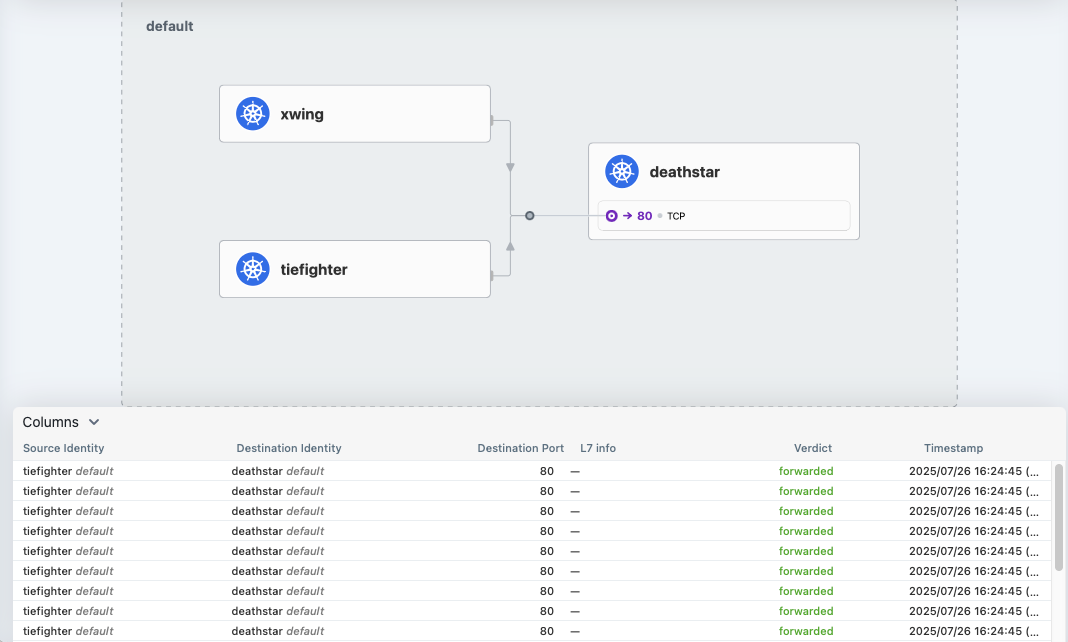 Hubble UI에서 모니터링
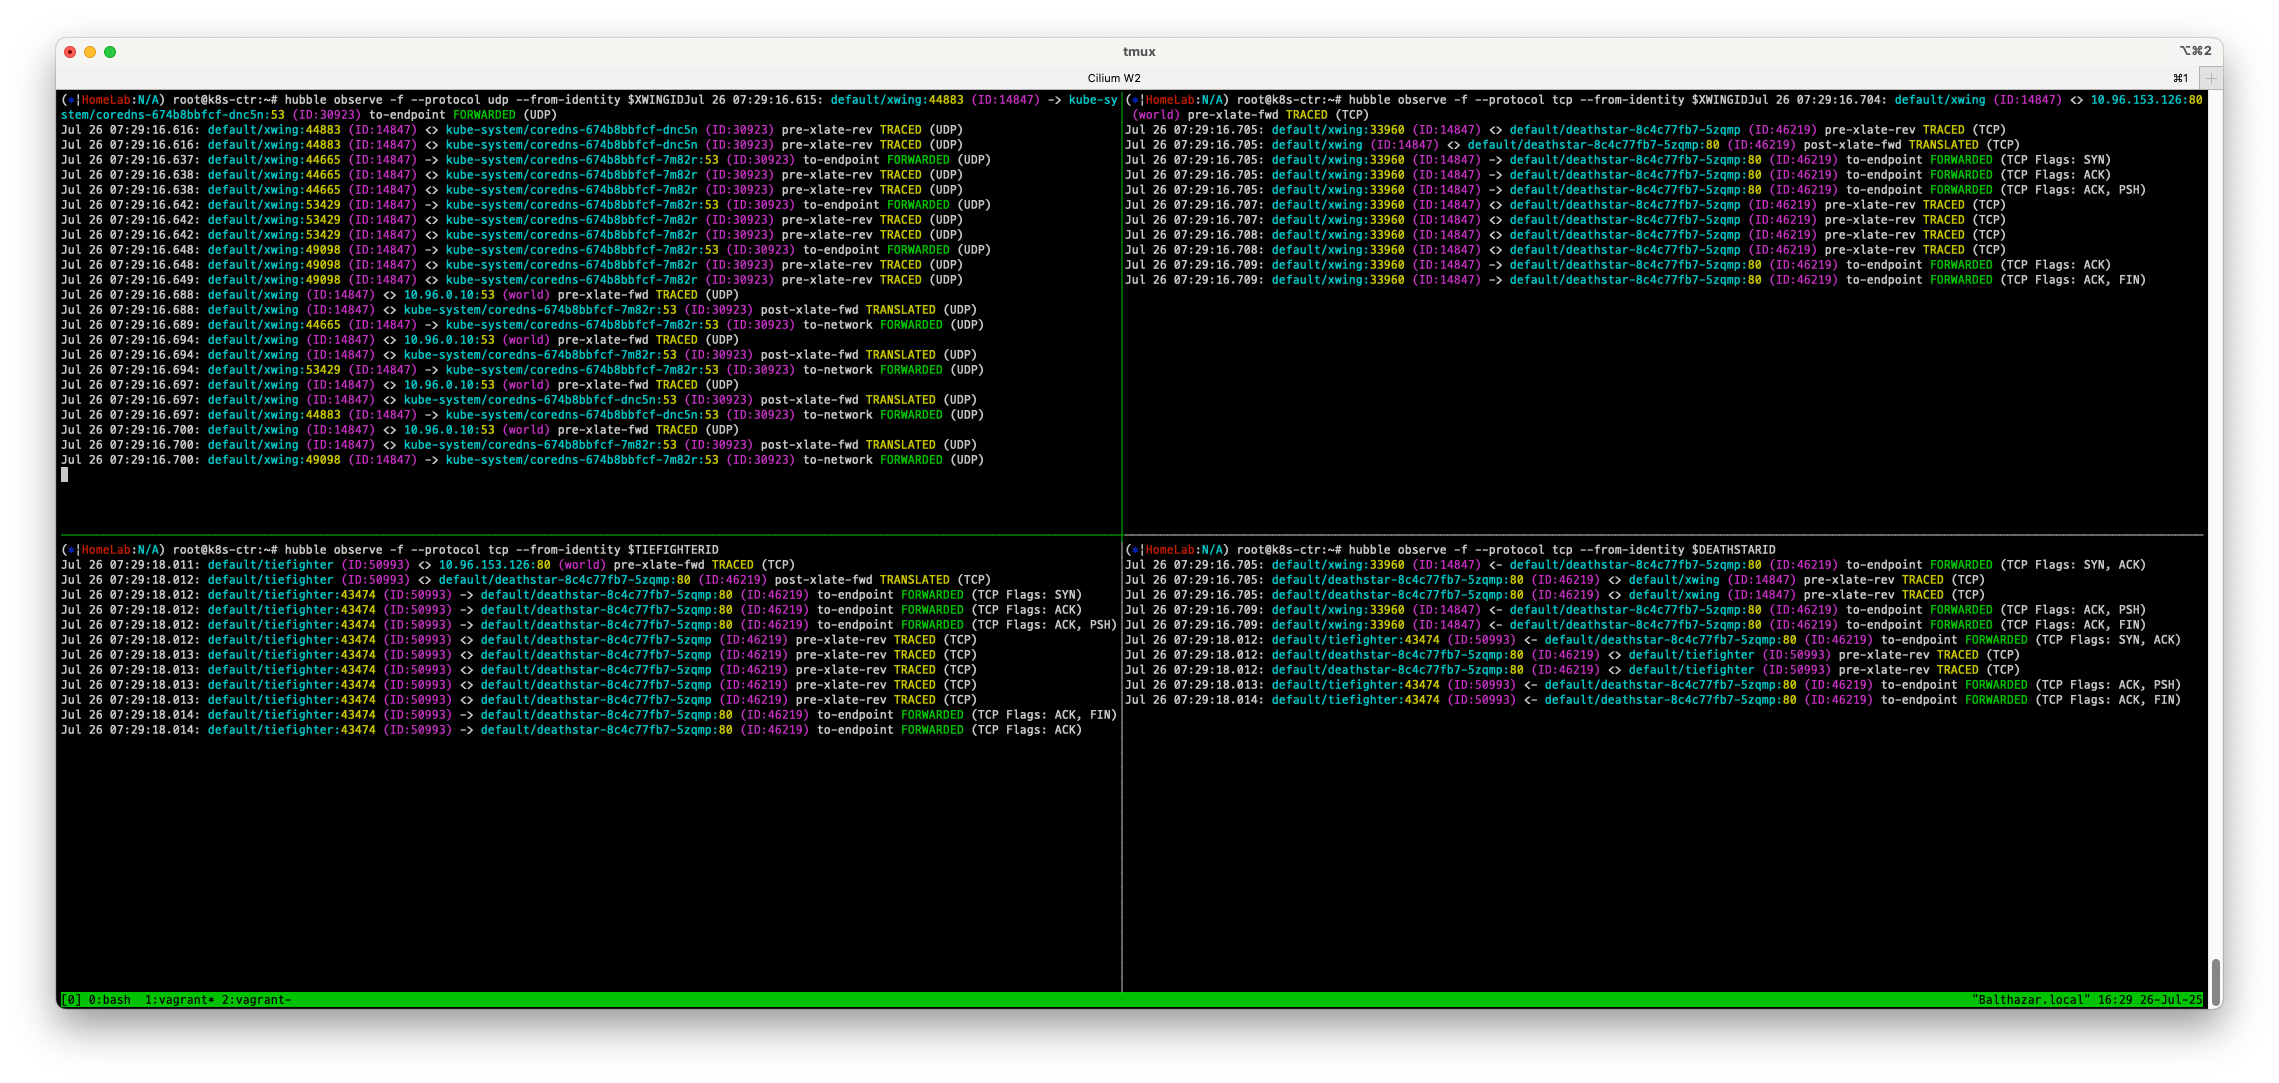 hubble observe에서 모니터링
- 제국군 우주선 tiefighter 뿐만아니라 연합군 우주선 xwing의 착륙 요청도 허용되고 있는것을 확인할 수 있습니다.
L3/L4 정책 적용
- 관련문서
- L3/L4 정책을 적용하여 제국 우주선만 착륙 요청을 허용하도록 합니다.
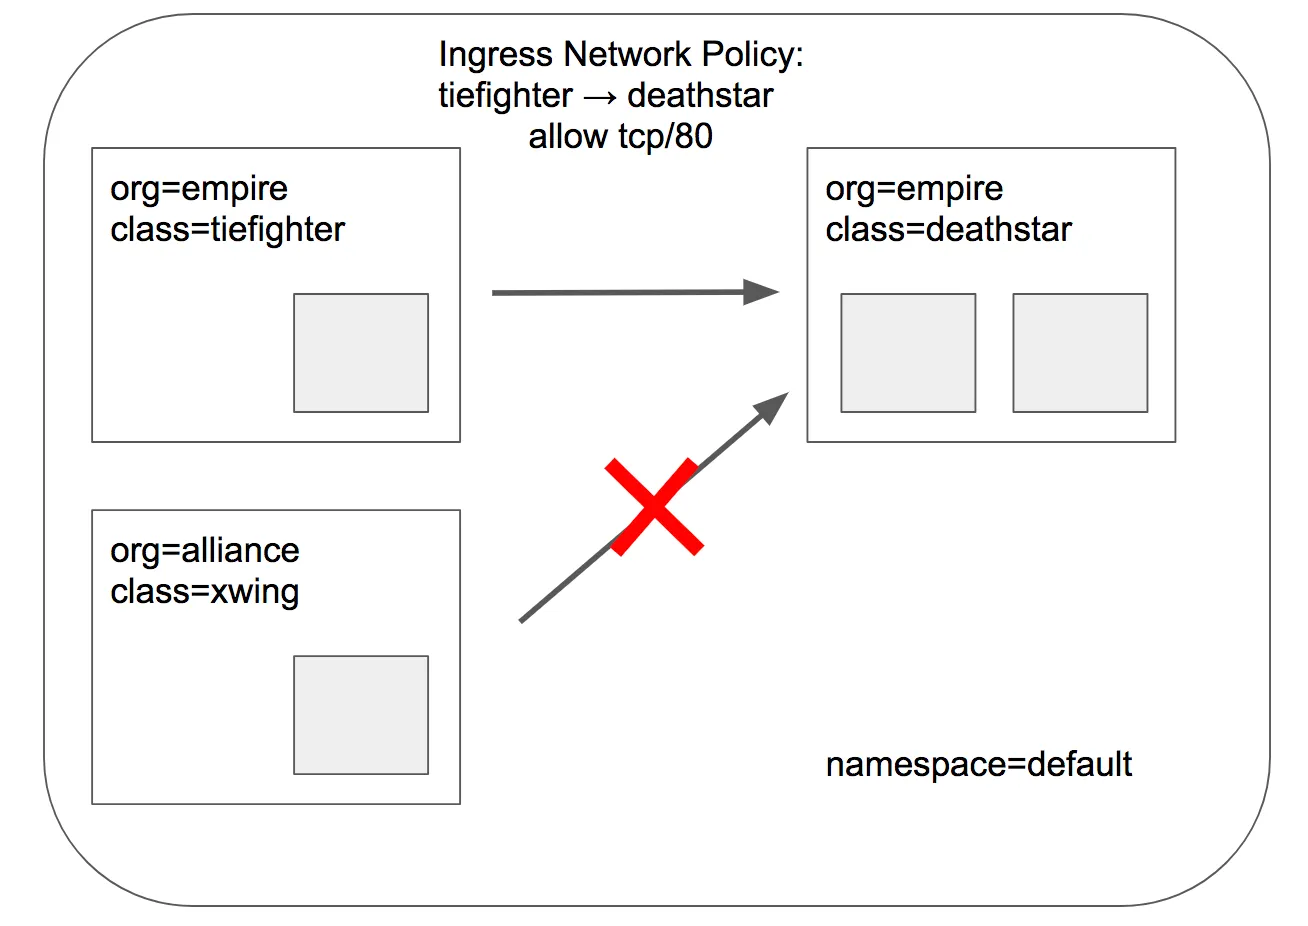 L3/L4 정책 적용 후 목표 상태
- Cilium의 보안정책은 Endpoint의 IP주소는 중요하지 않고, Pod의 label을 사용하여 보안 정책을 정의할 수 있습니다.
- 아래의 정책을 적용하여 제국 우주선만 착륙 요청을 허용하도록 합니다. 이렇게하면 org=empire 라벨이 있는 Pod만 착륙 요청을 허용하게 되고, 해당 라벨이 없는 파드는 deathstar 서비스에 연결조차 할 수 없습니다. 이 정책은 IP 프로토콜(네트워크 계층 3)와 TCP 프로토콜(전송 계층 4)에만 적용하는 L3/L4 네트워크 보안 정책이라고 합니다.
- 참고 : Cilium은 상태별 연결 추적을 수행합니다. 즉, 프론트엔드가 백엔드에 도달할 수 있으면, 동일한 TCP/UDP 연결내의 응답은 자동으로 허용된다는것을 의미합니다.
# CiliumNetworkPolicy
## CiliumNetworkPolicys는 "endpointSelector"를 사용하여 팟 레이블에서 정책이 적용되는 소스와 목적지를 식별합니다.
## 아래 정책은 TCP 포트 80에서 레이블(org=empire)이 있는 모든 팟에서 레이블(org=empire, class=deathstar)이 있는 데스스타 팟으로 전송되는 트래픽을 화이트리스트로 작성합니다.
apiVersion: "cilium.io/v2"
kind: CiliumNetworkPolicy
metadata:
  name: "rule1"
spec:
  description: "L3-L4 policy to restrict deathstar access to empire ships only"
  endpointSelector:
    matchLabels:
      org: empire
      class: deathstar
  ingress:
  - fromEndpoints:
    - matchLabels:
        org: empire
    toPorts:
    - ports:
      - port: "80"
        protocol: TCP
$ kubectl apply -f https://raw.githubusercontent.com/cilium/cilium/1.17.6/examples/minikube/sw_l3_l4_policy.yaml
# => ciliumnetworkpolicy.cilium.io/rule1 created
$ kubectl get cnp
# => NAME    AGE   VALID
#    rule1   8s    True
$ kubectl get cnp -o json | jq
# => ...
#          "spec": {
#            "description": "L3-L4 policy to restrict deathstar access to empire ships only",
#            "endpointSelector": {
#              "matchLabels": {
#                "class": "deathstar",
#                "org": "empire"
#              }
#            },
#            "ingress": [ {
#                 "fromEndpoints": [ { "matchLabels": { "org": "empire" } } ],
#                 "toPorts": [ { "ports": [ { "port": "80", "protocol": "TCP" } ] } ]
#            } ]
#          },
#    ...

# 모니터링
$ hubble observe -f --type drop

# 호출 시도 1
$ kubectl exec xwing -- curl -s -XPOST deathstar.default.svc.cluster.local/v1/request-landing --connect-timeout 2
# => command terminated with exit code 28
# <span style="color: green;">👉 연합군의 우주선 xwing의 착륙 요청은 거부되었습니다!</span>

# <span style="color: green;">👉 DROP 된 패킷 모니터링</span>
# => (⎈|HomeLab:N/A) root@k8s-ctr:~# hubble observe -f --type drop
#    Jul 26 07:50:53.384: default/xwing:46590 (ID:14847) <> default/deathstar-8c4c77fb7-h2rsh:80 (ID:46219) Policy denied DROPPED (TCP Flags: SYN)
#    Jul 26 07:50:54.407: default/xwing:46590 (ID:14847) <> default/deathstar-8c4c77fb7-h2rsh:80 (ID:46219) Policy denied DROPPED (TCP Flags: SYN)

# 모니터링
$ hubble observe -f --protocol tcp --from-identity $DEATHSTARID

# 호출 시도 2
$ kubectl exec tiefighter -- curl -s -XPOST deathstar.default.svc.cluster.local/v1/request-landing
# => Ship landed
# <span style="color: green;">👉 제국군의 우주선 tiefighter의 착륙 요청은 허용되었습니다!</span>

# <span style="color: green;">👉 허용된 패킷 모니터링</span>
# => (⎈|HomeLab:N/A) root@k8s-ctr:~# hubble observe -f --protocol tcp --from-identity $DEATHSTARID
#    Jul 26 07:52:52.016: default/tiefighter:43410 (ID:50993) <- default/deathstar-8c4c77fb7-5zqmp:80 (ID:46219) to-endpoint FORWARDED (TCP Flags: SYN, ACK)
#    Jul 26 07:52:52.016: default/deathstar-8c4c77fb7-5zqmp:80 (ID:46219) <> default/tiefighter (ID:50993) pre-xlate-rev TRACED (TCP)
#    Jul 26 07:52:52.016: default/deathstar-8c4c77fb7-5zqmp:80 (ID:46219) <> default/tiefighter (ID:50993) pre-xlate-rev TRACED (TCP)
#    Jul 26 07:52:52.019: default/tiefighter:43410 (ID:50993) <- default/deathstar-8c4c77fb7-5zqmp:80 (ID:46219) to-endpoint FORWARDED (TCP Flags: ACK, PSH)
#    Jul 26 07:52:52.021: default/tiefighter:43410 (ID:50993) <- default/deathstar-8c4c77fb7-5zqmp:80 (ID:46219) to-endpoint FORWARDED (TCP Flags: ACK, FIN)
- 정책을 확인해보겠습니다.
# deathstar 에 ingress 에 policy 활성화 확인
$ c0 endpoint list
$ c1 endpoint list
# => ENDPOINT   POLICY (ingress)   POLICY (egress)   IDENTITY   LABELS (source:key[=value])                                                  IPv6   IPv4          STATUS
#               ENFORCEMENT        ENFORCEMENT
#    ...
#    507        <span style="color: green;">Enabled</span>            Disabled          46219      k8s:app.kubernetes.io/name=deathstar                                                172.20.1.67   ready
#    ...
$ c2 endpoint list
# => ENDPOINT   POLICY (ingress)   POLICY (egress)   IDENTITY   LABELS (source:key[=value])                                                  IPv6   IPv4           STATUS
#               ENFORCEMENT        ENFORCEMENT
#    ...
#    1391       <span style="color: green;">Enabled</span>            Disabled          46219      k8s:app.kubernetes.io/name=deathstar                                                172.20.2.251   ready
#    ...

$ kc describe cnp rule1
# => ...
#    Spec:
#      Description:  L3-L4 policy to restrict deathstar access to empire ships only
#      Endpoint Selector:
#        Match Labels:
#          Class:  deathstar
#          Org:    empire
#      Ingress:
#        From Endpoints:
#          Match Labels:
#            Org:  empire
#        To Ports:
#          Ports:
#            Port:      80
#            Protocol:  TCP
#    ...
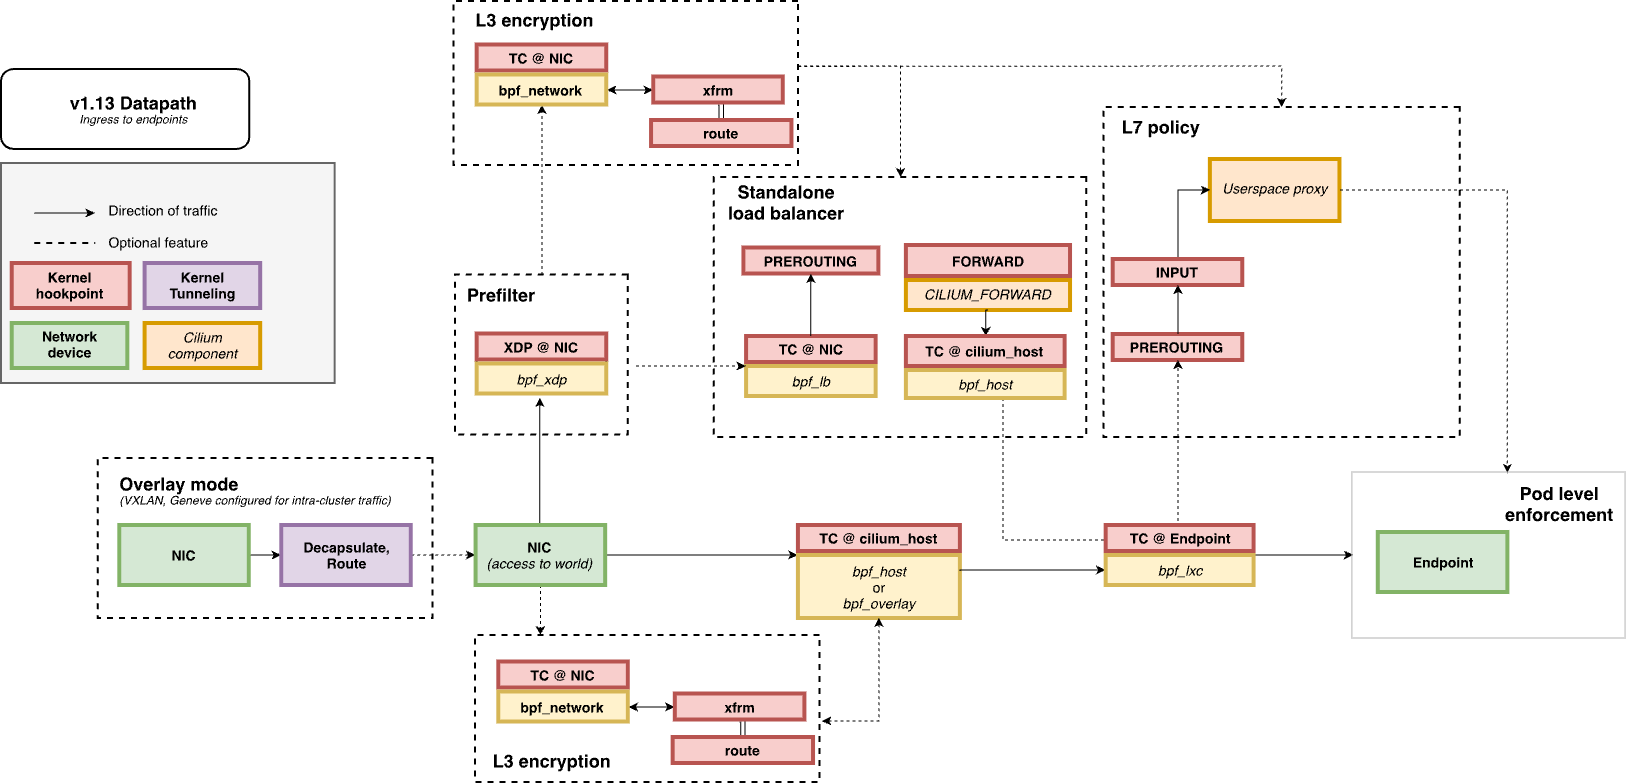
- Life of a Packet : L7 동작 처리는 cilium-envoy 데몬셋이 담당합니다. Docs
#
$ kubectl get ds -n kube-system
# => NAME           DESIRED   CURRENT   READY   UP-TO-DATE   AVAILABLE   NODE SELECTOR            AGE
#    cilium         3         3         3       3            3           kubernetes.io/os=linux   2d17h
#    cilium-envoy   3         3         3       3            3           kubernetes.io/os=linux   2d17h

$ kubectl get pod -n kube-system -l k8s-app=cilium-envoy -owide
# => NAME                 READY   STATUS    RESTARTS        AGE     IP               NODE      NOMINATED NODE   READINESS GATES
#    cilium-envoy-q97fq   1/1     Running   3 (3h59m ago)   2d16h   192.168.10.102   k8s-w2    <none>           <none>
#    cilium-envoy-xzxd6   1/1     Running   3 (3h59m ago)   2d16h   192.168.10.101   k8s-w1    <none>           <none>
#    cilium-envoy-zzzw5   1/1     Running   3 (3h59m ago)   2d17h   192.168.10.100   k8s-ctr   <none>           <none>

#
$ kc describe ds -n kube-system cilium-envoy
# =>     Mounts:
#          /sys/fs/bpf from bpf-maps (rw)
#          /var/run/cilium/envoy/ from envoy-config (ro)
#          /var/run/cilium/envoy/artifacts from envoy-artifacts (ro)
#          <span style="color: green;">/var/run/cilium/envoy/sockets from envoy-sockets (rw)</span>
#    ...
#       envoy-config:
#        Type:      ConfigMap (a volume populated by a ConfigMap)
#        Name:      <span style="color: green;">cilium-envoy-config</span>
#        Optional:  false
#    ...

$ kubectl exec -it -n kube-system ds/cilium -c cilium-agent -- ss -xnp | grep -i -envoy
# => u_str  ESTAB  0  0  /var/run/cilium/envoy/sockets/admin.sock  16193  *  16192
#    u_str  ESTAB  0  0  /var/run/cilium/envoy/sockets/admin.sock  17068  *  17067
#    u_str  ESTAB  0  0  /var/run/cilium/envoy/sockets/xds.sock    15993  *  15992  users:(("cilium-agent",pid=1,fd=106))

$ kc describe cm -n kube-system cilium-envoy-config
# => ...
#    Data
#    ====
#    bootstrap-config.json:
#    ----
#    {"admin":{"address":{"pipe":{"path":"/var/run/cilium/envoy/sockets/admin.sock"}}}...
#    ...
HTTP-aware L7 정책 적용 및 테스트
- HTTP-aware L7 정책을 적용하고 테스트해보겠습니다. Docs
- 이전의 간단한 시나리오에서는 tiefighter와 xwing에게 deathstar API에 대한 전체 액세스 권한을 부여하거나, 접속 자체를 차단하는것으로 충분햇습니다.
- 하지만 마이크로 서비스 간의 강력한 보안(즉, 최소 권한 격리를 강제하는 것)을 제공하기 위해서는 deathstar API를 호출하는 각 서비스가 운영에 필요한 HTTP 요청만 수행하도록 제한 할 수 있어야 합니다.
- 예를 들어 deathstar 서비스가 임의의 제국 우주선이 호출해서는 안 되는 유지보수 API를 제공한다고 가정해보겠습니다.
# 모니터링 >> Layer3/4 에서는 애플리케이션 상태를 확인 할 수 없음!
$ hubble observe -f --protocol tcp --from-identity $DEATHSTARID
# => Jul 26 08:29:39.157: default/tiefighter:48472 (ID:50993) <- default/deathstar-8c4c77fb7-h2rsh:80 (ID:46219) to-network FORWARDED (TCP Flags: SYN, ACK)
#    Jul 26 08:29:39.161: default/tiefighter:48472 (ID:50993) <- default/deathstar-8c4c77fb7-h2rsh:80 (ID:46219) to-network FORWARDED (TCP Flags: ACK, PSH)
#    Jul 26 08:29:39.164: default/tiefighter:48472 (ID:50993) <- default/deathstar-8c4c77fb7-h2rsh:80 (ID:46219) to-network FORWARDED (TCP Flags: ACK, FIN)
#    Jul 26 08:29:39.201: default/tiefighter:48472 (ID:50993) <- default/deathstar-8c4c77fb7-h2rsh:80 (ID:46219) to-endpoint FORWARDED (TCP Flags: SYN, ACK)
#    Jul 26 08:29:39.201: default/deathstar-8c4c77fb7-h2rsh:80 (ID:46219) <> default/tiefighter (ID:50993) pre-xlate-rev TRACED (TCP)
#    Jul 26 08:29:39.201: default/deathstar-8c4c77fb7-h2rsh:80 (ID:46219) <> default/tiefighter (ID:50993) pre-xlate-rev TRACED (TCP)
#    Jul 26 08:29:39.205: default/tiefighter:48472 (ID:50993) <- default/deathstar-8c4c77fb7-h2rsh:80 (ID:46219) to-endpoint FORWARDED (TCP Flags: ACK, PSH)
#    Jul 26 08:29:39.207: default/tiefighter:48472 (ID:50993) <- default/deathstar-8c4c77fb7-h2rsh:80 (ID:46219) to-endpoint FORWARDED (TCP Flags: ACK, FIN)

# 호출해서는 안 되는 일부 유지보수 API를 노출
$ kubectl exec tiefighter -- curl -s -XPUT deathstar.default.svc.cluster.local/v1/exhaust-port
# => Panic: deathstar exploded
# <span style="color: green;">👉 임의로 호출해서는 안되는 API가 실행되어 deathstar가 폭발했습니다!</span>
cilium을 통한 L7 정책 적용
- cilium은 HTTP 계층(L7) 정책을 적용하여 tiefighter가 사용할 수 있는 API URL을 제한할 수 있습니다. 다음은 tiefighter가 POST /v1/request-landing URL에만 액세스할 수 있도록 하는 정책입니다.
# 기존 rule1 정책을 업데이트 해서 사용
apiVersion: "cilium.io/v2"
kind: CiliumNetworkPolicy
metadata:
  name: "rule1"
spec:
  description: "L7 policy to restrict access to specific HTTP call"
  endpointSelector:
    matchLabels:
      org: empire
      class: deathstar
  ingress:
  - fromEndpoints:
    - matchLabels:
        org: empire
    toPorts:
    - ports:
      - port: "80"
        protocol: TCP
      rules:
        http:
        - method: "POST"
          path: "/v1/request-landing"
- tiefigher 에는 착륙 요청만 허용하는 L7 정책 적용후 deathstar 서비스에 착륙 요청을 해보겠습니다.
# Update the existing rule to apply L7-aware policy to protect deathstar using:
$ kubectl apply -f https://raw.githubusercontent.com/cilium/cilium/1.17.6/examples/minikube/sw_l3_l4_l7_policy.yaml
# => ciliumnetworkpolicy.cilium.io/rule1 configured
$ kubectl get cnp
# => NAME    AGE    VALID
#    rule1   168m   True
$ kc describe cnp
# => ...
#    Spec:
#      Description:  L7 policy to restrict access to specific HTTP call
#      Endpoint Selector:
#        Match Labels:
#          Class:  deathstar
#          Org:    empire
#      Ingress:
#        From Endpoints:
#          Match Labels:
#            Org:  empire
#        To Ports:
#          Ports:
#            Port:      80
#            Protocol:  TCP
#          Rules:
#            Http:
#              Method:  POST
#              Path:    /v1/request-landing
#    ...
$ c0 policy get

# 파드 이름 지정하여 모니터링
$ hubble observe -f --pod deathstar --protocol http
Jul 20 01:28:02.184: default/tiefighter:59020 (ID:19274) -> default/deathstar-8c4c77fb7-9klws:80 (ID:318) http-request FORWARDED (HTTP/1.1 POST http://deathstar.default.svc.cluster.local/v1/request-landing)
Jul 20 01:28:02.190: default/tiefighter:59020 (ID:19274) <- default/deathstar-8c4c77fb7-9klws:80 (ID:318) http-response FORWARDED (HTTP/1.1 200 6ms (POST http://deathstar.default.svc.cluster.local/v1/request-landing))

# 착륙 요청을 테스트해보겠습니다.
$ kubectl exec tiefighter -- curl -s -XPOST deathstar.default.svc.cluster.local/v1/request-landing
# => Ship landed
# <span style="color: green;">👉 당연히 API 호출에 성공합니다.</span>
- 이번에는 tiefighter가 허용되지 않은 API를 호출해보겠습니다.
# 파드 이름 지정하여 드랍된 패킷 모니터링
$ hubble observe -f --pod deathstar --verdict DROPPED
# => Jul 26 10:48:17.734: default/tiefighter:40606 (ID:50993) -> default/deathstar-8c4c77fb7-h2rsh:80 (ID:46219) http-request DROPPED (HTTP/1.1 PUT http://deathstar.default.svc.cluster.local/v1/exhaust-port)

# 혹은
$ c1 monitor -v --type l7
$ c2 monitor -v --type l7
# => <- Request http from 721 ([k8s:app.kubernetes.io/name=tiefighter k8s:class=tiefighter k8s:io.cilium.k8s.namespace.labels.kubernetes.io/metadata.name=default k8s:io.cilium.k8s.policy.cluster=default k8s:io.cilium.k8s.policy.serviceaccount=default k8s:io.kubernetes.pod.namespace=default k8s:org=empire]) to 1391 ([k8s:app.kubernetes.io/name=deathstar k8s:class=deathstar k8s:io.cilium.k8s.namespace.labels.kubernetes.io/metadata.name=default k8s:io.cilium.k8s.policy.cluster=default k8s:io.cilium.k8s.policy.serviceaccount=default k8s:io.kubernetes.pod.namespace=default k8s:org=empire]), identity 50993->46219, verdict Denied PUT http://deathstar.default.svc.cluster.local/v1/exhaust-port => 0
#    <- Response http to 721 ([k8s:app.kubernetes.io/name=tiefighter k8s:class=tiefighter k8s:io.cilium.k8s.namespace.labels.kubernetes.io/metadata.name=default k8s:io.cilium.k8s.policy.cluster=default k8s:io.cilium.k8s.policy.serviceaccount=default k8s:io.kubernetes.pod.namespace=default k8s:org=empire]) from 1391 ([k8s:app.kubernetes.io/name=deathstar k8s:class=deathstar k8s:io.cilium.k8s.namespace.labels.kubernetes.io/metadata.name=default k8s:io.cilium.k8s.policy.cluster=default k8s:io.cilium.k8s.policy.serviceaccount=default k8s:io.kubernetes.pod.namespace=default k8s:org=empire]), identity 46219->50993, verdict Forwarded PUT http://deathstar.default.svc.cluster.local/v1/exhaust-port => 403

# 앞서 deathstar를 폭파시켰던 tiefighter에게 허용되지 않은 API를 호출해보겠습니다.
$ kubectl exec tiefighter -- curl -s -XPUT deathstar.default.svc.cluster.local/v1/exhaust-port
# => Access denied
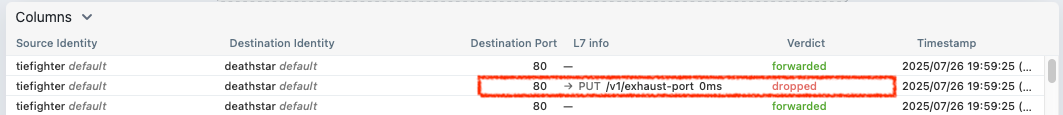 L7 정책에 의해 허용되지 않은 API 호출이 거부된 모습
- xwing으로 착륙요청을 해서 위와 차이점을 확인해보겠습니다.
# 모니터링 : 파드 이름 지정
$ hubble observe -f --pod xwing
# 호출 시도 : 위와 아래 실행 종료의 차이점을 이해해보자!
$ kubectl exec xwing -- curl -s -XPOST deathstar.default.svc.cluster.local/v1/request-landing --connect-timeout 2
# => command terminated with exit code 28
# (⎈|HomeLab:N/A) root@k8s-ctr:~# hubble observe -f --pod xwing
# => ...
# Jul 26 10:50:31.048: default/xwing:57832 (ID:14847) -> default/deathstar-8c4c77fb7-h2rsh:80 (ID:46219) to-network FORWARDED (TCP Flags: SYN)
# Jul 26 10:50:31.049: default/xwing:57832 (ID:14847) <> default/deathstar-8c4c77fb7-h2rsh:80 (ID:46219) policy-verdict:none INGRESS DENIED (TCP Flags: SYN)
# Jul 26 10:50:31.049: default/xwing:57832 (ID:14847) <> default/deathstar-8c4c77fb7-h2rsh:80 (ID:46219) Policy denied DROPPED (TCP Flags: SYN)
# ...
# Jul 26 10:50:32.053: default/xwing:57832 (ID:14847) <> default/deathstar-8c4c77fb7-h2rsh:80 (ID:46219) policy-verdict:none INGRESS DENIED (TCP Flags: SYN)
# Jul 26 10:50:32.053: default/xwing:57832 (ID:14847) <> default/deathstar-8c4c77fb7-h2rsh:80 (ID:46219) Policy denied DROPPED (TCP Flags: SYN)
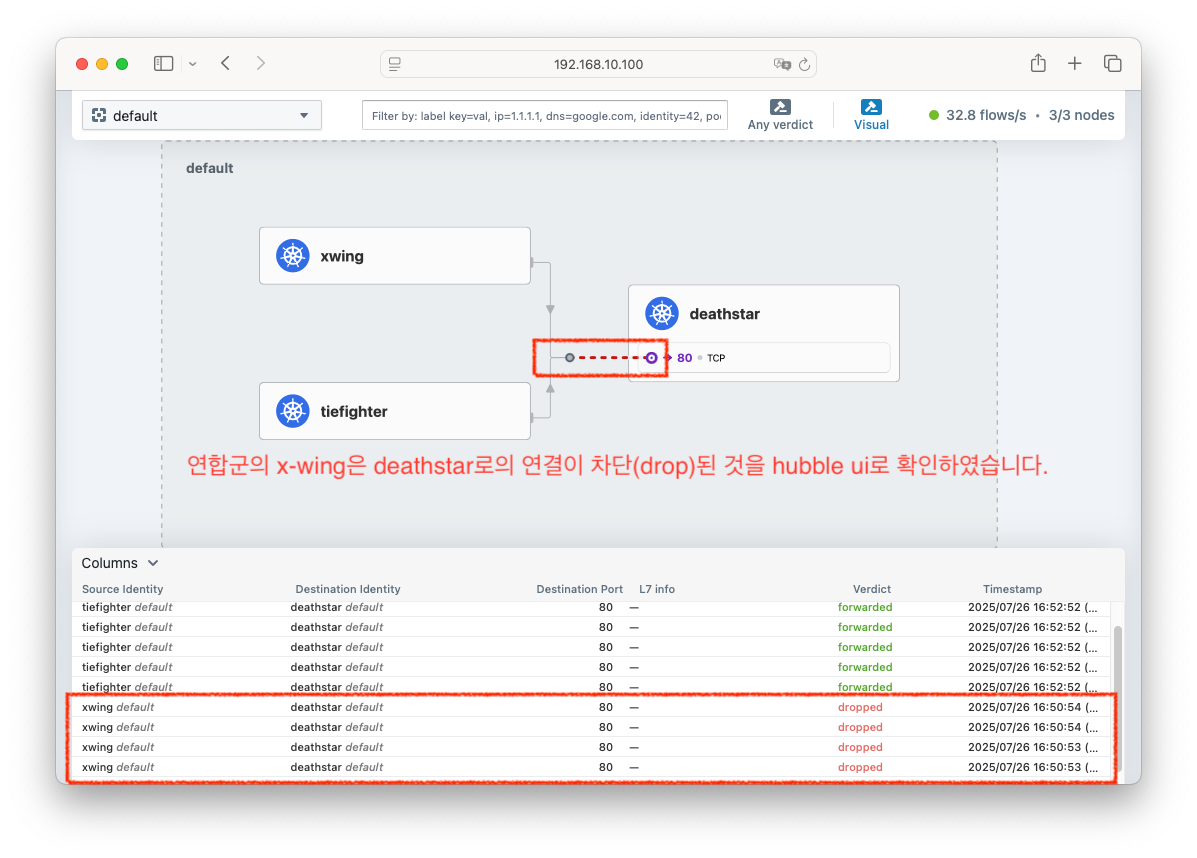
# <span style="color: green;">👉 xwing의 deathstar로의 접근은 TCP (L4) 연결 자체가 차단(DROP)됨을 확인할 수 있습니다.</span>
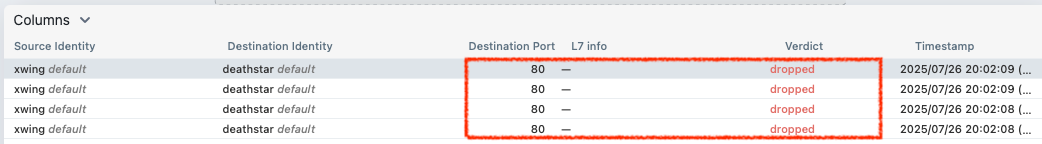 xwing이 L7 정책 이전에 L4 정책에 의해 deathstar로의 접근이 차단된 모습
- 다음 실습을 위해 리소스를 삭제하겠습니다.
# 다음 실습을 위해 리소스 삭제
$ kubectl delete -f https://raw.githubusercontent.com/cilium/cilium/1.17.6/examples/minikube/http-sw-app.yaml
# => service "deathstar" deleted
#    deployment.apps "deathstar" deleted
#    pod "tiefighter" deleted
#    pod "xwing" deleted
$ kubectl delete cnp rule1
# => ciliumnetworkpolicy.cilium.io "rule1" deleted

# 삭제 확인
$ kubectl get cnp
# => No resources found in default namespace.
Configuring Hubble Exporter
- 흐름 로그 - Docs
- Hubble Exporter는 나중에 사용할 수 있도록 Hubble flows 로그를 파일에 저장하는 cilium-agent의 기능입니다.
- Hubble Exporter는 file rotation, size limits, filters, field masks를 지원합니다.
- Hubble Exporter는 다음과 같이 설정합니다.
# <span style="color: green;">👉 이미 cilium 설치할때 적용되어서 실습 과정에는 적용할 필요가 없습니다.</span>
$ helm upgrade cilium cilium/cilium --namespace kube-system --reuse-values \
   --set hubble.enabled=true \
   --set hubble.export.static.enabled=true \
   --set hubble.export.static.filePath=/var/run/cilium/hubble/events.log

$ kubectl -n kube-system rollout status ds/cilium
- Hubble Exporter의 설정을 확인해보겠습니다.
# 확인
$ kubectl get cm -n kube-system cilium-config -o json | grep hubble-export
$ cilium config view | grep hubble-export
# => hubble-export-allowlist
#    hubble-export-denylist
#    hubble-export-fieldmask
#    hubble-export-file-max-backups   5     # rotate된 Hubble export 파일을 유지할 수 있는 최대 개수. (기본값: 5)
#    hubble-export-file-max-size-mb   10    # Hubble export 파일을 rotate할 때의 크기(MB). (기본값: 10)
#    hubble-export-file-path          /var/run/cilium/hubble/events.log   # 대상 로그 파일의 경로. (기본값: /var/run/cilium/hubble/events.log)

# Verify that flow logs are stored in target files
$ kubectl -n kube-system exec ds/cilium -- tail -f /var/run/cilium/hubble/events.log
# <span style="color: green;">👉 로그가 계속 나옵니다.</span>
$ kubectl -n kube-system exec ds/cilium -- sh -c 'tail -f /var/run/cilium/hubble/events.log' | jq
# <span style="color: green;">👉 로그가 json 형태로 계속 나옵니다.</span>
Prometheus와 Grafana를 통한 모니터링
- Prometheus와 Grafana를 통해 Cilium의 모니터링을 할 수 있습니다. Docs
- 널리 알려진 툴들이라 다들 아시겠지만 간략하게 소개해 보겠습니다.
- Prometheus : 오픈 소스 모니터링 시스템으로, 시계열 데이터베이스를 사용하여 메트릭을 수집하고 저장합니다. 일종의 TSDB(Time Series Database)로, 메트릭을 수집하고 쿼리할 수 있는 강력한 기능을 제공합니다.
- Grafana : 시각화 도구로, Prometheus와 같은 데이터 소스에서 수집된 메트릭을 대시보드 형태로 시각화할 수 있습니다. 다양한 플러그인을 통해 다양한 데이터 소스를 지원합니다.
- 추천글
샘플 애플리케이션 배포 및 확인
- Prometheus와 Grafana를 설치하기 전에 샘플 애플리케이션을 배포하고, Cilium의 모니터링을 확인해보겠습니다.
# 샘플 애플리케이션 배포
$ cat << EOF | kubectl apply -f -
apiVersion: apps/v1
kind: Deployment
metadata:
  name: webpod
spec:
  replicas: 2
  selector:
    matchLabels:
      app: webpod
  template:
    metadata:
      labels:
        app: webpod
    spec:
      affinity:
        podAntiAffinity:
          requiredDuringSchedulingIgnoredDuringExecution:
          - labelSelector:
              matchExpressions:
              - key: app
                operator: In
                values:
                - sample-app
            topologyKey: "kubernetes.io/hostname"
      containers:
      - name: webpod
        image: traefik/whoami
        ports:
        - containerPort: 80
---
apiVersion: v1
kind: Service
metadata:
  name: webpod
  labels:
    app: webpod
spec:
  selector:
    app: webpod
  ports:
  - protocol: TCP
    port: 80
    targetPort: 80
  type: ClusterIP
EOF

# k8s-ctr 노드에 curl-pod 파드 배포
$ cat <<EOF | kubectl apply -f -
apiVersion: v1
kind: Pod
metadata:
  name: curl-pod
  labels:
    app: curl
spec:
  nodeName: k8s-ctr
  containers:
  - name: curl
    image: nicolaka/netshoot
    command: ["tail"]
    args: ["-f", "/dev/null"]
  terminationGracePeriodSeconds: 0
EOF
- 샘플 애플리케이션이 배포되었는지 확인해보겠습니다.
# 배포 확인
$ kubectl get deploy,svc,ep webpod -owide
# => NAME                     READY   UP-TO-DATE   AVAILABLE   AGE   CONTAINERS   IMAGES           SELECTOR
#    deployment.apps/webpod   2/2     2            2           41s   webpod       traefik/whoami   app=webpod
#
#    NAME             TYPE        CLUSTER-IP     EXTERNAL-IP   PORT(S)   AGE   SELECTOR
#    service/webpod   ClusterIP   10.96.147.79   <none>        80/TCP    41s   app=webpod
#
#    NAME               ENDPOINTS                       AGE
#    endpoints/webpod   172.20.1.4:80,172.20.2.101:80   41s
$ kubectl get endpointslices -l app=webpod
# => NAME           ADDRESSTYPE   PORTS   ENDPOINTS                 AGE
#    webpod-g9ldp   IPv4          80      172.20.1.4,172.20.2.101   49s
$ kubectl get ciliumendpoints
# => NAME                      SECURITY IDENTITY   ENDPOINT STATE   IPV4           IPV6
#    curl-pod                  472                 ready            172.20.0.43
#    webpod-697b545f57-mvz92   18655               ready            172.20.2.101
#    webpod-697b545f57-ns4sw   18655               ready            172.20.1.4
$ kubectl exec -it -n kube-system ds/cilium -c cilium-agent -- cilium-dbg endpoint list
# => ENDPOINT   POLICY (ingress)   POLICY (egress)   IDENTITY   LABELS (source:key[=value])                                                  IPv6   IPv4           STATUS
#               ENFORCEMENT        ENFORCEMENT
#    272        Disabled           Disabled          472        k8s:app=curl                                                                        172.20.0.43    ready
#                                                               k8s:io.cilium.k8s.namespace.labels.kubernetes.io/metadata.name=default
#                                                               k8s:io.cilium.k8s.policy.cluster=default
#                                                               k8s:io.cilium.k8s.policy.serviceaccount=default
#                                                               k8s:io.kubernetes.pod.namespace=default
#    1332       Disabled           Disabled          1          k8s:node-role.kubernetes.io/control-plane                                                          ready
#                                                               k8s:node.kubernetes.io/exclude-from-external-load-balancers
#                                                               reserved:host
#    1814       Disabled           Disabled          30923      k8s:io.cilium.k8s.namespace.labels.kubernetes.io/metadata.name=kube-system          172.20.0.134   ready
#                                                               k8s:io.cilium.k8s.policy.cluster=default
#                                                               k8s:io.cilium.k8s.policy.serviceaccount=coredns
#                                                               k8s:io.kubernetes.pod.namespace=kube-system
#                                                               k8s:k8s-app=kube-dns

# 통신 확인
$ kubectl exec -it curl-pod -- curl webpod | grep Hostname
# => Hostname: webpod-697b545f57-mvz92
$ kubectl exec -it curl-pod -- sh -c 'while true; do curl -s webpod | grep Hostname; sleep 1; done'
# => Hostname: webpod-697b545f57-ns4sw
#    Hostname: webpod-697b545f57-mvz92
#    Hostname: webpod-697b545f57-mvz92
#    Hostname: webpod-697b545f57-ns4sw
#    ...
Prometheus 와 Grafana 설치 및 설정
- 이번 예제는 Prometheus와 Grafana를 한번에 설치하는 예제를 따라하며 진행해보겠습니다. Youtube 영상
- 배포 파일에 Grafana에는 Cilium Dashboard가 포함되어 있습니다.
- 이번 예제 배포파일에는 Prometheus와 Grafana가 Cilium과 Hubble의 메트릭을 자동으로 수집하고 시각화할 수 있도록 설정되어 있습니다.
#
$ kubectl apply -f https://raw.githubusercontent.com/cilium/cilium/1.17.6/examples/kubernetes/addons/prometheus/monitoring-example.yaml
# => namespace/cilium-monitoring created
#    serviceaccount/prometheus-k8s created
#    configmap/grafana-config created
#    configmap/grafana-cilium-dashboard created
#    configmap/grafana-cilium-operator-dashboard created
#    configmap/grafana-hubble-dashboard created
#    configmap/grafana-hubble-l7-http-metrics-by-workload created
#    configmap/prometheus created
#    clusterrole.rbac.authorization.k8s.io/prometheus created
#    clusterrolebinding.rbac.authorization.k8s.io/prometheus created
#    service/grafana created
#    service/prometheus created
#    deployment.apps/grafana created
#    deployment.apps/prometheus created

#
$ kubectl get deploy,pod,svc,ep -n cilium-monitoring
# => NAME                         READY   UP-TO-DATE   AVAILABLE   AGE
#    deployment.apps/grafana      0/1     1            0           14s
#    deployment.apps/prometheus   1/1     1            1           14s
#
#    NAME                              READY   STATUS              RESTARTS   AGE
#    pod/grafana-5c69859d9-7cpvl       0/1     ContainerCreating   0          14s
#    pod/prometheus-6fc896bc5d-9xfll   1/1     Running             0          14s
#
#    NAME                 TYPE        CLUSTER-IP     EXTERNAL-IP   PORT(S)    AGE
#    service/grafana      ClusterIP   10.96.10.188   <none>        3000/TCP   14s
#    service/prometheus   ClusterIP   10.96.218.78   <none>        9090/TCP   14s
#
#    NAME                   ENDPOINTS           AGE
#    endpoints/grafana      <none>              14s
#    endpoints/prometheus   172.20.2.115:9090   14s
$ kubectl get cm -n cilium-monitoring
# => NAME                                         DATA   AGE
#    grafana-cilium-dashboard                     1      23s
#    grafana-cilium-operator-dashboard            1      23s
#    grafana-config                               3      24s
#    grafana-hubble-dashboard                     1      23s
#    grafana-hubble-l7-http-metrics-by-workload   1      23s
#    kube-root-ca.crt                             1      24s
#    prometheus                                   1      23s

# 프로메테우스 서버 설정
$ kc describe cm -n cilium-monitoring prometheus

# 그라파나 서버 설정
$ kc describe cm -n cilium-monitoring grafana-config

# 그파라나 대시보드들 주입을 위한 설정 확인
$ kc describe cm -n cilium-monitoring grafana-cilium-dashboard
$ kc describe cm -n cilium-monitoring grafana-hubble-dashboard
# <span style="color: green;">👉 설정 내용이 길어서 캡쳐는 생략하겠습니다.</span>
Cilium과 Hubble 메트릭 켜기
- 이번 예제에는 Cilium과 Hubble의 메트릭을 Prometheus와 Grafana가 수집할 수 있도록 설정되어 있습니다.
- 하지만 기본적으로 Cilium, Hubble, Cilium Operator의 메트릭은 비활성화되어 있습니다.
- 따라서 Prometheus와 Grafana가 Cilium과 Hubble의 메트릭을 수집할 수 있도록 설정을 변경해야 합니다. Docs
- 메트릭을 활성화하면 구성요소가 실행중인 모든 노드에 각각
9962,9965,9963포트가 열립니다. - Cilium, Hubble, Cilium Operator은 다음 helm 값으로 서로 독립적으로 활성화 할 수 있습니다.
-
prometheus.enabled=true: cilium-agent 메트릭 켜기. -
operator.prometheus.enabled=true: cilium-operator 메트릭 켜기. -
hubble.metrics.enabled: 주어진 Hubble 메트릭 목록을 켜기- Hubble 메트릭 실행을 위해서는
hubble.enabled=true으로 설정되어 있어야 합니다. - Hubble exported metrics에서 활성화 할 수 있는 Hubble 메트릭을 확인 가능합니다..
- Hubble 메트릭 실행을 위해서는
-
# <span style="color: green;">👉 이번 예제에서는 이미 활성화 되어있습니다.</span>
$ helm install cilium cilium/cilium --version 1.17.6 \
   --namespace kube-system \
   --set prometheus.enabled=true \
   --set operator.prometheus.enabled=true \
   --set hubble.enabled=true \
   --set hubble.metrics.enableOpenMetrics=true \
   --set hubble.metrics.enabled="{dns,drop,tcp,flow,port-distribution,icmp,httpV2:exemplars=true;labelsContext=source_ip\,source_namespace\,source_workload\,destination_ip\,destination_namespace\,destination_workload\,traffic_direction}"

# 호스트에 포트 정보 확인
$ ss -tnlp | grep -E '9962|9963|9965'
# => LISTEN 0      4096                *:9962             *:*    users:(("cilium-agent",pid=2870,fd=7))     # cilium 메트릭
#    LISTEN 0      4096                *:9963             *:*    users:(("cilium-operator",pid=1917,fd=7))  # cilium-opeator 메트릭
#    LISTEN 0      4096                *:9965             *:*    users:(("cilium-agent",pid=2870,fd=31))    # hubble 메트릭
# <span style="color: green;">👉 9963 포트는 cilium-operator 메트릭을 위한 포트로 컨트롤 플레인 노드에서만 열리는듯 합니다.</span>

$ for i in w1 w2 ; do echo ">> node : k8s-$i <<"; sshpass -p 'vagrant' ssh vagrant@k8s-$i sudo ss -tnlp | grep -E '9962|9963|9965' ; echo; done
# => >> node : k8s-w1 <<
#    LISTEN 0      4096               *:9965             *:*    users:(("cilium-agent",pid=2032,fd=39))     # hubble 메트릭
#    LISTEN 0      4096               *:9962             *:*    users:(("cilium-agent",pid=2032,fd=7))      # cilium 메트릭
#
#    >> node : k8s-w2 <<
#    LISTEN 0      4096               *:9962             *:*    users:(("cilium-agent",pid=2036,fd=7))      # cilium 메트릭
#    LISTEN 0      4096               *:9965             *:*    users:(("cilium-agent",pid=2036,fd=30))     # hubble 메트릭
Prometheus와 Grafana 접속해서 확인
- Prometheus와 Grafana를 호스트에서 접속하기 위해 NodePort를 사용하여 접속할 수 있도록 설정하겠습니다.
#
$ kubectl get svc -n cilium-monitoring
# => NAME         TYPE        CLUSTER-IP     EXTERNAL-IP   PORT(S)    AGE
#    grafana      ClusterIP   10.96.10.188   <none>        3000/TCP   10m
#    prometheus   ClusterIP   10.96.218.78   <none>        9090/TCP   10m

# NodePort 설정
$ kubectl patch svc -n cilium-monitoring prometheus -p '{"spec": {"type": "NodePort", "ports": [{"port": 9090, "targetPort": 9090, "nodePort": 30001}]}}'
# => service/prometheus patched
$ kubectl patch svc -n cilium-monitoring grafana -p '{"spec": {"type": "NodePort", "ports": [{"port": 3000, "targetPort": 3000, "nodePort": 30002}]}}'
# => service/grafana patched

# 확인
$ kubectl get svc -n cilium-monitoring
# => NAME         TYPE       CLUSTER-IP     EXTERNAL-IP   PORT(S)          AGE
#    grafana      NodePort   10.96.10.188   <none>        3000:30002/TCP   11m
#    prometheus   NodePort   10.96.218.78   <none>        9090:30001/TCP   11m
# <span style="color: green;">👉 NodePort가 각각 30002, 30001로 설정되었습니다.</span>

# 접속 주소 확인
$ echo "http://192.168.10.100:30001"  # prometheus
$ echo "http://192.168.10.100:30002"  # grafana
- 간혹 Prometheus의 접속시 서버와 브라우저간의 시간 차이가 발생할 수 있습니다.
- 이때는 모든 가상머신을 reboot후 재접속하면 해결되는듯 합니다.
- Prometheus 접속 확인
- 설정확인
- Status > Configuration에서 Prometheus 설정을 확인할 수 있습니다.
- Status > Service Discovery에서 kubernetes의 통한 서비스 디스커버리를 통해 수집된 대상을 확인할 수 있습니다.
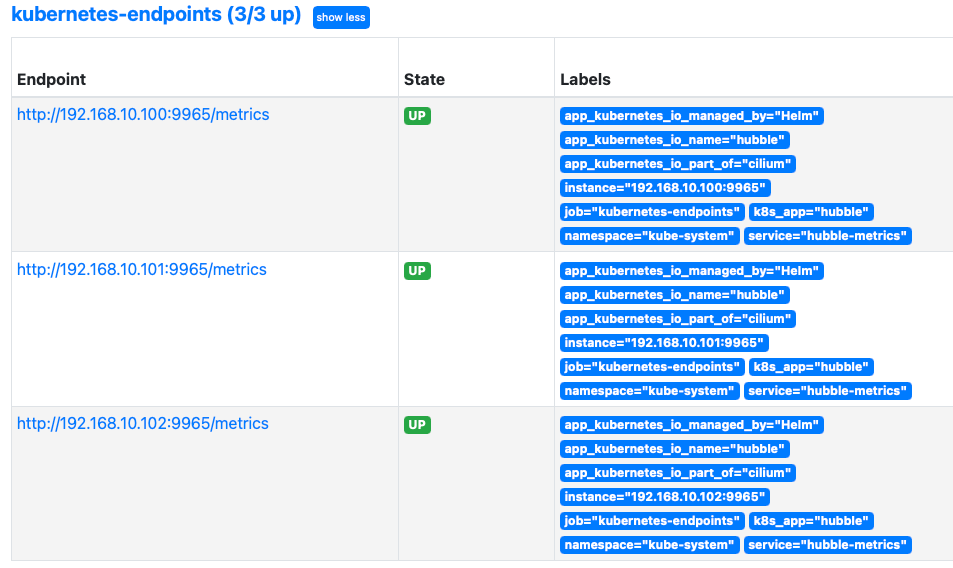
- Status > Targets에서 Cilium, Hubble, Cilium Operator의 메트릭이 수집되고 있는지 확인할 수 있습니다.
- 기본 쿼리창에서
cilium_,cilium_operator_,hubble_로 시작하는 메트릭을 검색해보면 Cilium, Hubble, Cilium Operator의 메트릭을 확인할 수 있습니다.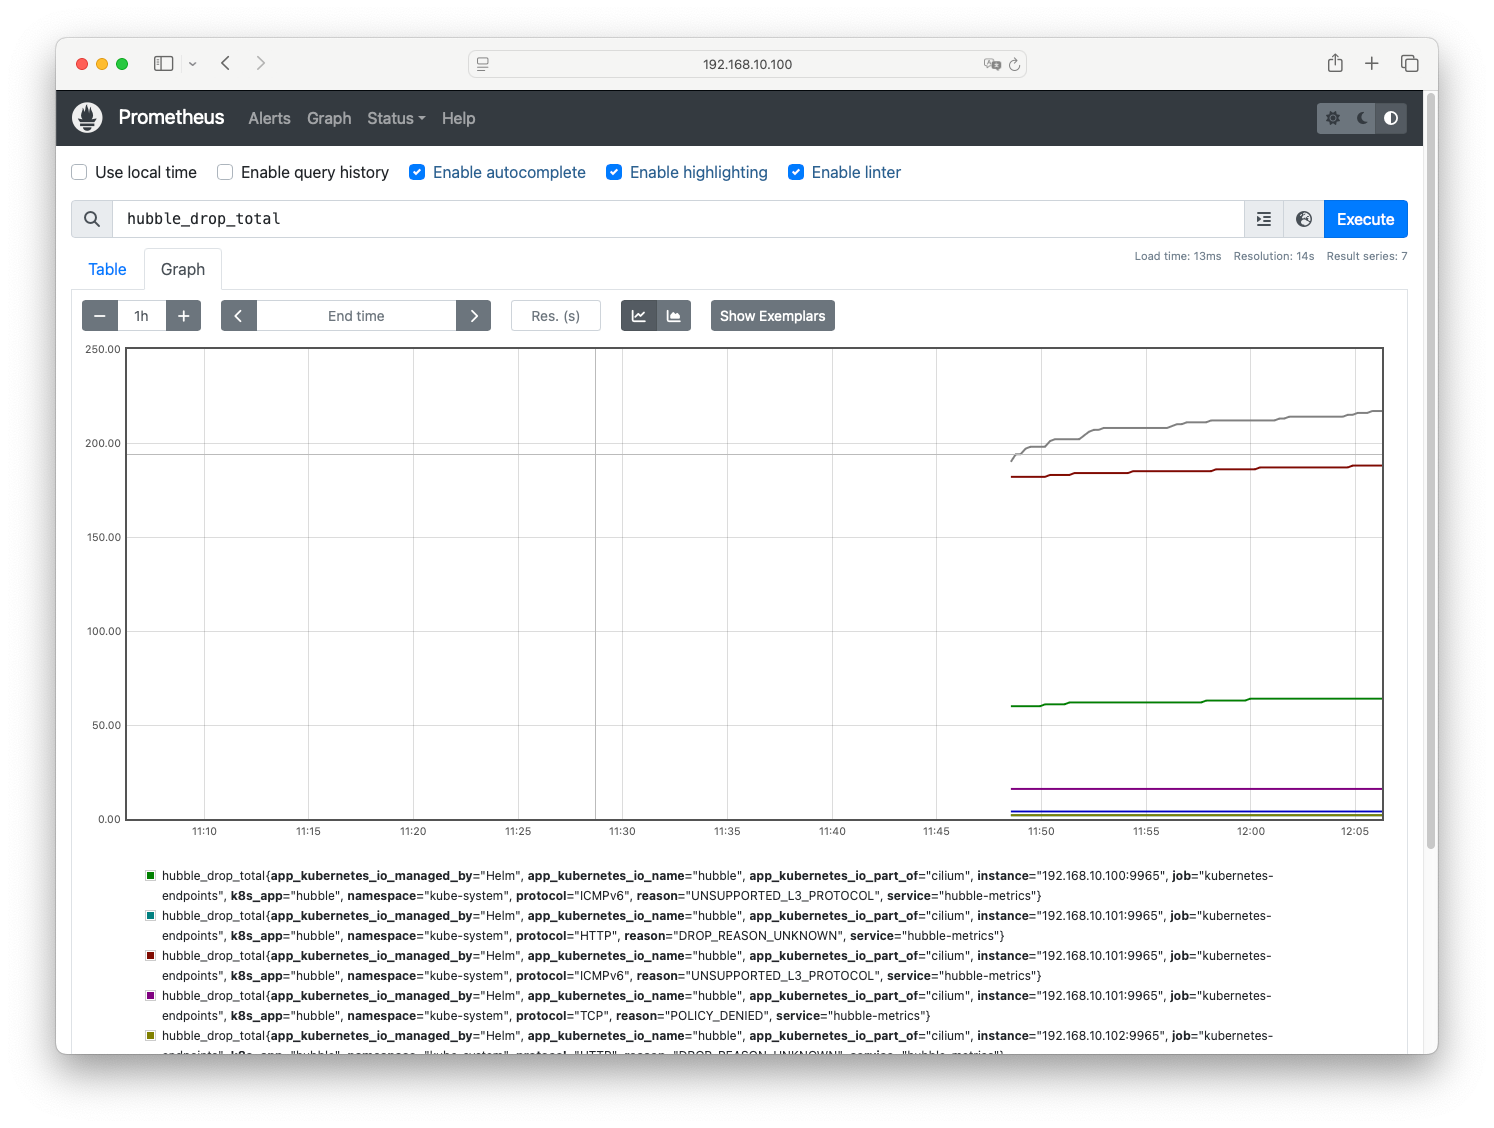
hubble_drop_total메트릭 검색 예제
- 설정확인
- Grafana 접속 확인
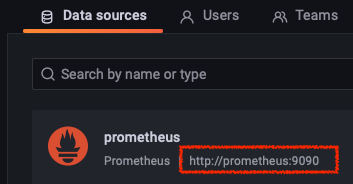
- Configuration > Data Sources에서 Prometheus 서비스의 도메인 주소를 확인할 수 있고, Prometheus에서 수집한 메트릭을 사용하고 있는것을 확인할 수 있습니다.
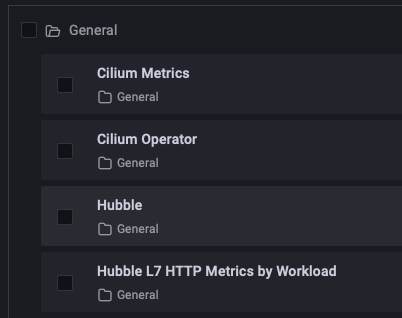
- Dashboard > General : 미리 설정된 대시보드를 확인할 수 있습니다.
- Configuration > Data Sources에서 Prometheus 서비스의 도메인 주소를 확인할 수 있고, Prometheus에서 수집한 메트릭을 사용하고 있는것을 확인할 수 있습니다.
- Cilium Metric 대시보드 및 간단 쿼리문 알아보기 : Generic, API, Cilium(BPF, kvstore, NW info, Endpoints, k8s integration)
- Cilium Metric 대시보드는 전체적인 Cilium의 메트릭을 확인할 수 있는 대시보드입니다.
- map ops (average node) 패널 분석
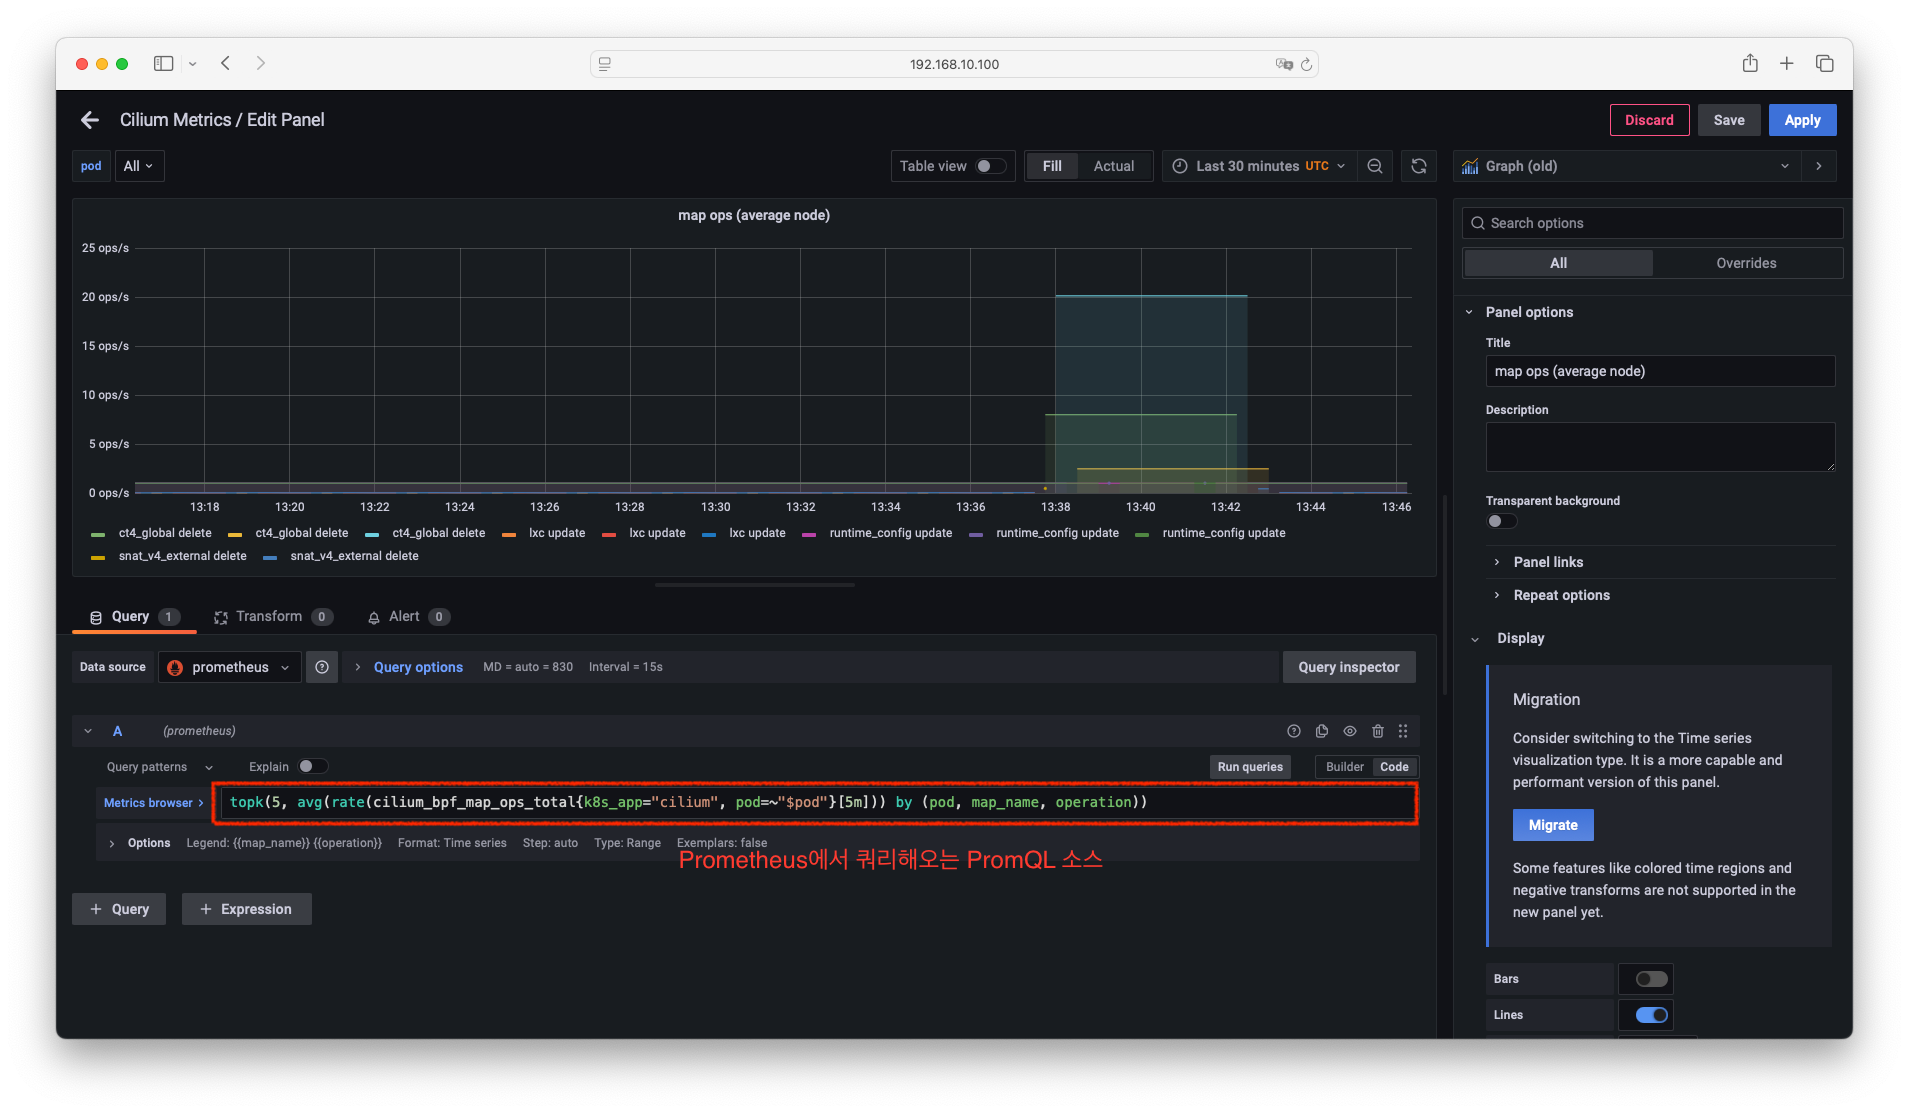
- 위의 캡쳐에서 본바와 같이 아래와 같은 PromQL 쿼리문을 사용합니다.
topk(5, avg(rate(cilium_bpf_map_ops_total{k8s_app="cilium", pod=~"$pod"}[5m])) by (pod, map_name, operation)) - Prometheus에서 위의 쿼리를 바탕으로 쿼리를 해서 분석해 보겠습니다.
-
공식문서에서 확인해보면
cilium_bpf_map_ops_total는 수행된 eBPF Map 작업수를 나타냅니다.# cilium_bpf_map_ops_total # <span style="color: green;">👉 전체 cilium_bpf_map_ops_total 조회</span> cilium_bpf_map_ops_total{k8s_app="cilium"} # <span style="color: green;">👉 k8s_app이 cilium인 cilium_bpf_map_ops_total 조회</span> cilium_bpf_map_ops_total{k8s_app="cilium", pod="cilium-4hghz"} # <span style="color: green;">👉 k8s_app이 cilium이면서 pod 명이 cilium-4hghz인 cilium_bpf_map_ops_total 조회</span> # 최근 5분 간의 데이터로 증가율 계산 rate(cilium_bpf_map_ops_total{k8s_app="cilium"}[5m]) # Graph 확인 # <span style="color: green;">👉 k8s_app이 cilium인 cilium_bpf_map_ops_total 의 5분간 데이터 증가율 계산</span> # 여러 시계열(metric series)의 값의 평균 avg(rate(cilium_bpf_map_ops_total{k8s_app="cilium"}[5m])) # <span style="color: green;">👉 k8s_app이 cilium인 cilium_bpf_map_ops_total 의 5분간 데이터 증가율의 평균</span> # 집계 함수(예: sum, avg, max, rate)와 함께 사용하여 어떤 레이블(label)을 기준으로 그룹화할지를 지정하는 그룹핑(grouping) avg(rate(cilium_bpf_map_ops_total{k8s_app="cilium"}[5m])) by (pod) # <span style="color: green;">👉 pod명으로 그룹핑</span> avg(rate(cilium_bpf_map_ops_total{k8s_app="cilium"}[5m])) by (pod, map_name) # <span style="color: green;">👉 pod명과 map이름으로 그룹핑</span> avg(rate(cilium_bpf_map_ops_total{k8s_app="cilium"}[5m])) by (pod, map_name, operation) # Graph 확인 # <span style="color: green;">👉 pod명과 map이름, map 동작으로 그룹핑</span> # 시계열 중에서 가장 큰 k개를 선택 topk(5, avg(rate(cilium_bpf_map_ops_total{k8s_app="cilium"}[5m]))) by (pod, map_name, operation) topk(5, avg(rate(cilium_bpf_map_ops_total{k8s_app="cilium", pod="cilium-4hghz"}[5m]))) by (pod, map_name, operation)
-
공식문서에서 확인해보면
- Grafana 해당 대시보드 편집해서 Variables을 확인해보겠습니다.
- 앞선 PromQL 쿼리문에서
$pod는 Variables로 설정되어 있습니다. 이를 확인해보겠습니다. - 해당 dashboard > Settings > Variables에서
$pod를 확인할 수 있습니다.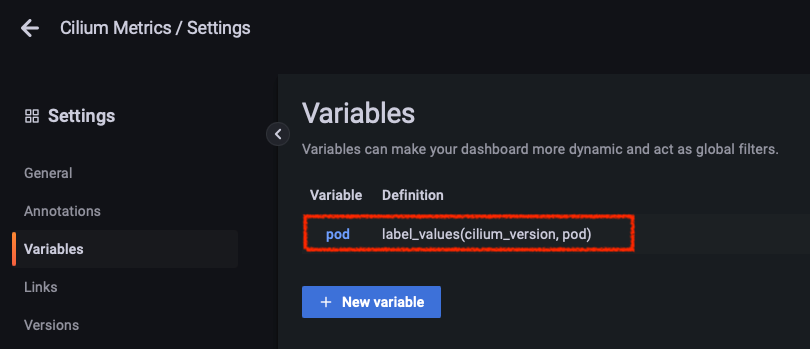
-
label_values(cilium_version, pod)는 Prometheus에서cilium_version으로 쿼리해서 얻어지는 label들 중pod값을 취함을 의미합니다.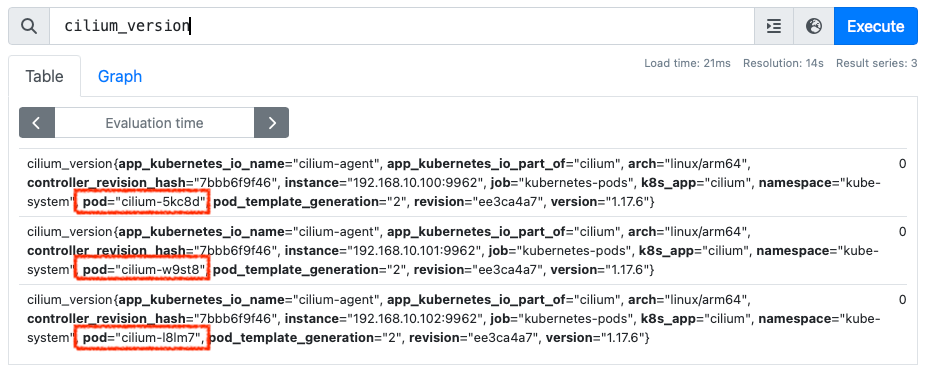
- 앞선 PromQL 쿼리문에서
- 위의 캡쳐에서 본바와 같이 아래와 같은 PromQL 쿼리문을 사용합니다.
- Cilium Operator 대시보드 : IPAM 관련 메트릭을 주로 확인할 수 있습니다. IPAM은 IP 주소 관리(IP Address Management)로, Cilium에서 IP 주소를 할당하고 관리하는 기능입니다.
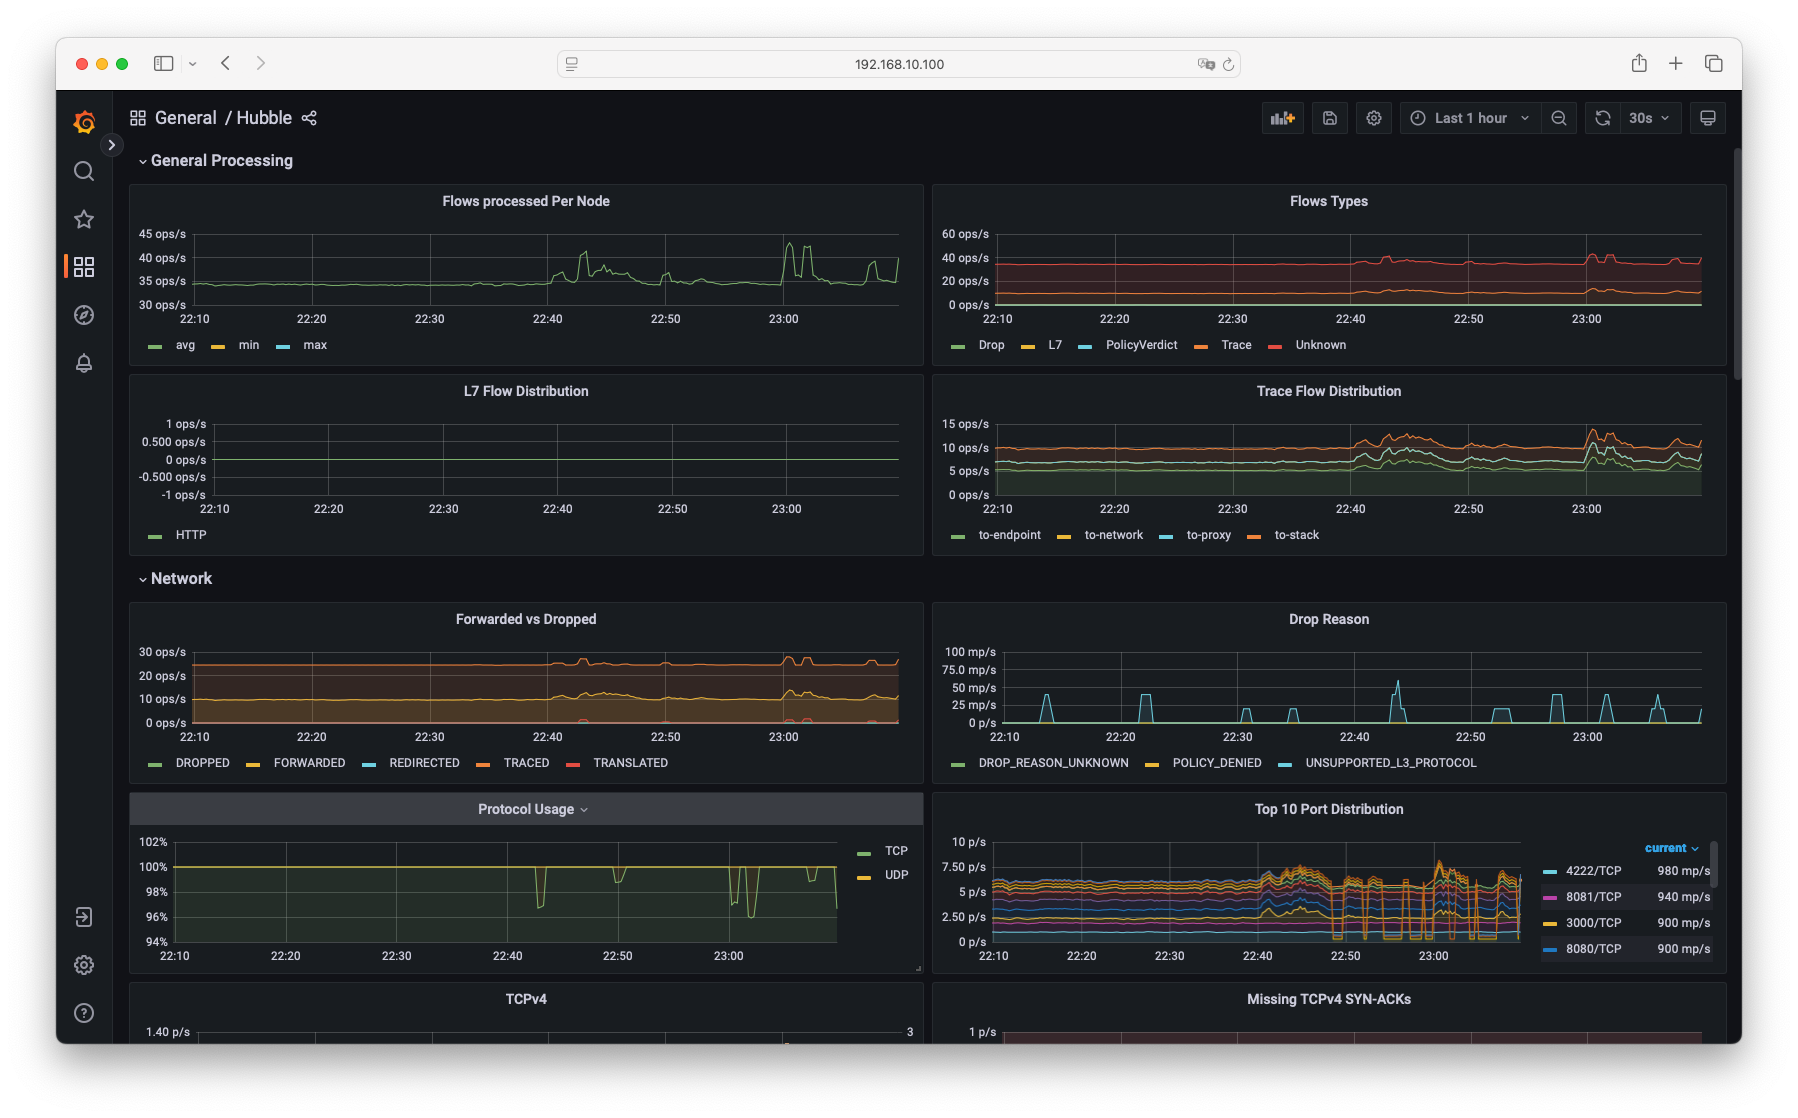
- Hubble 대시보드 : General Processing, Network, Network Policy, HTTP, DNS 관련 메트릭을 확인할 수 있습니다.
- Hubble L7 HTTP Metrics by Workload 대시보드 : HTTP 요청 및 응답에 대한 메트릭을 확인할 수 있습니다.
- Hubble L7 HTTP Metrics by Workload 대시보드 : HTTP 요청 및 응답에 대한 메트릭을 확인할 수 있습니다.
Monitoring & Metrics
Cilium Metrics 설정 및 수집 방법
- Cilium Metrics는 Cilium 자체의 상태, 즉 Cilium Agent, Cilium Envoy, Cilium Operator 프로세스에 대한 메트릭을 수집하고 제공합니다.
- Prometheus에서 수집할 수 있도록 하려면
prometheus.enabled=true로 설정해서 helm chart를 설치해야 합니다. - Cilium Metrics는
cilium_라는 접두사를 가진 메트릭을 Prometheus에 제공합니다. - Envoy Metrics는
envoy_라는 접두사를 가진 메트릭을 Prometheus에 제공하며, Cilium이 정의한 메트릭은cilium_envoy_라는 접두사를 가집니다. - Kubernetes에서 실행 및 수집될때 pod 이름과 namespace를 포함한 레이블을 추가합니다.
- 설정 방법 (본 실습에서는 이미 적용되어 있습니다.)
helm install cilium cilium/cilium --version 1.17.6 \ --namespace kube-system \ --set prometheus.enabled=true \ --set operator.prometheus.enabled=true # The ports can be configured via prometheus.port, envoy.prometheus.port, or operator.prometheus.port respectively. --set prometheus.port --set envoy.prometheus.port --set operator.prometheus.port ... - Metric이 활성화되면 모든 Cilium 구성요소에는 다음과 같은 annotation이 표시됩니다. annotation은 Prometheus가 메트릭을 수집할지 여부를 알리는데 사용됩니다.
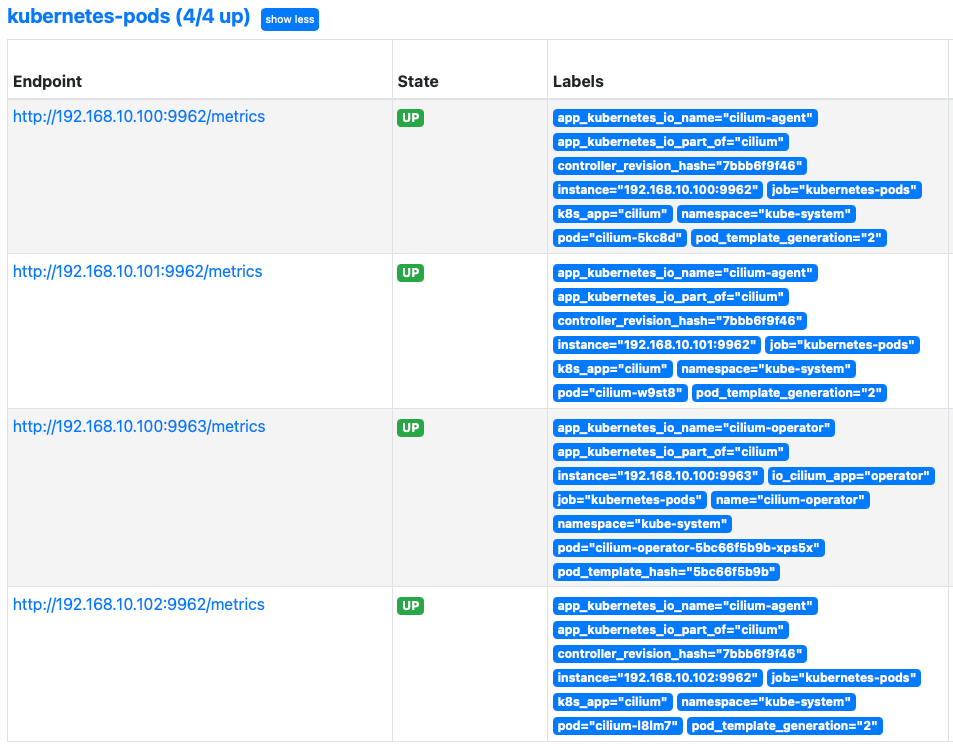
# cilium-agent 데몬셋 파드 $ kubectl describe pod -n kube-system -l k8s-app=cilium | grep prometheus # => prometheus.io/port: 9962 # prometheus.io/scrape: true $ curl 192.168.10.100:9962/metrics # => # HELP cilium_agent_api_process_time_seconds Duration of processed API calls labeled by path, method and return code. # # TYPE cilium_agent_api_process_time_seconds histogram # cilium_agent_api_process_time_seconds_bucket{method="DELETE",path="/v1/endpoint",return_code="404",le="0.005"} 3 # cilium_agent_api_process_time_seconds_bucket{method="DELETE",path="/v1/endpoint",return_code="404",le="0.01"} 3 # cilium_agent_api_process_time_seconds_bucket{method="DELETE",path="/v1/endpoint",return_code="404",le="0.025"} 3 # ... # cilium-operator 디플로이먼트 파드 $ kubectl describe pod -n kube-system -l name=cilium-operator | grep prometheus # => Annotations: prometheus.io/port: 9963 # prometheus.io/scrape: true $ curl 192.168.10.100:9963/metrics # => # HELP certwatcher_read_certificate_errors_total Total number of certificate read errors # # TYPE certwatcher_read_certificate_errors_total counter # certwatcher_read_certificate_errors_total 0 # # HELP certwatcher_read_certificate_total Total number of certificate reads # # TYPE certwatcher_read_certificate_total counter # certwatcher_read_certificate_total 0 # ... - Prometheus는 다음의 scrape_configs 섹션의 설정을 기반으로 자동으로 Cilium과 Envoy의 메트릭을 수집합니다.
$ kc describe cm -n cilium-monitoring prometheus
# => prometheus.yaml:
#    ...
#    scrape_configs:
#      ...
#      # https://github.com/prometheus/prometheus/blob/master/documentation/examples/prometheus-kubernetes.yml#L156
#      - job_name: 'kubernetes-pods'
#        kubernetes_sd_configs:
#          - role: pod
#        relabel_configs:
#          - source_labels: [__meta_kubernetes_pod_annotation_prometheus_io_scrape]
#            action: keep
#            regex: true
#          - source_labels: [__meta_kubernetes_pod_annotation_prometheus_io_path]
#            action: replace
#            target_label: __metrics_path__
#            regex: (.+)
#          - source_labels: [__address__, __meta_kubernetes_pod_annotation_prometheus_io_port]
#            action: replace
#            regex: (.+):(?:\d+);(\d+)
#            replacement: ${1}:${2}
#            target_label: __address__
#          - action: labelmap
#            regex: __meta_kubernetes_pod_label_(.+)
#          - source_labels: [__meta_kubernetes_namespace]
#            action: replace
#            target_label: namespace
#          - source_labels: [__meta_kubernetes_pod_name]
#            action: replace
#            target_label: pod
#          - source_labels: [__meta_kubernetes_pod_container_port_number]
#            action: keep
#            regex: \d+
#    ...
Hubble Metrics 설정 및 수집 방법
- Cilium Metric은 Cilium의 상태를 모니터링 할 수 있게 해주지만, Hubble Metric은 Cilium이 관리하는 Kubernetes pod의 네트워크 동작을 연결과 보안과 관련하여 모니터링 할 수 있게 해줍니다.
- 설정은 다음과 같습니다. (실습환경에서는 이미 적용되어 있습니다.)
$ helm install cilium cilium/cilium --version 1.17.6 \ --namespace kube-system \ --set prometheus.enabled=true \ --set operator.prometheus.enabled=true \ --set hubble.enabled=true \ --set hubble.metrics.enableOpenMetrics=true \ --set hubble.metrics.enabled="{dns,drop,tcp,flow,port-distribution,icmp,httpV2:exemplars=true;labelsContext=source_ip\,source_namespace\,source_workload\,destination_ip\,destination_namespace\,destination_workload\,traffic_direction}" --set hubble.metrics.port - L7 메트릭은 L7 가시성 활성화가 필요합니다.
-
hubble.metrics.enabled설정은 Hubble에서 수집할 메트릭을 지정합니다.- 예를 들어,
hubble.metrics.enabled값을 Helm 챠트 value에 설정하면, Cilium 챠트는hubble-metrics라는 헤드리스 서비스를 생성합니다. - 이 서비스는
prometheus.io/scrape:'true'annotation을 갖고 있어 Prometheus의 대상이 됩니다.
- 예를 들어,
# hubble-metrics 헤드리스 서비스 정보 확인
$ kubectl get svc -n kube-system hubble-metrics
# => NAME             TYPE        CLUSTER-IP   EXTERNAL-IP   PORT(S)    AGE
#    hubble-metrics   ClusterIP   None         <none>        9965/TCP   2d
$ kc describe svc -n kube-system hubble-metrics
# => Annotations:              meta.helm.sh/release-name: cilium
#                              meta.helm.sh/release-namespace: kube-system
#                              prometheus.io/port: 9965
#                              prometheus.io/scrape: true
#    ...
#    Endpoints:                192.168.10.102:9965,192.168.10.100:9965,192.168.10.101:9965
#    ...

$ curl 192.168.10.100:9965/metrics
# => # HELP grpc_server_handled_total Total number of RPCs completed on the server, regardless of success or failure.
#    # TYPE grpc_server_handled_total counter
#    grpc_server_handled_total{grpc_code="Aborted",grpc_method="Check",grpc_service="grpc.health.v1.Health",grpc_type="unary"} 0
#    grpc_server_handled_total{grpc_code="Aborted",grpc_method="GetAgentEvents",grpc_service="observer.Observer",grpc_type="server_stream"} 0
#    grpc_server_handled_total{grpc_code="Aborted",grpc_method="GetDebugEvents",grpc_service="observer.Observer",grpc_type="server_stream"} 0
#    ...

#
$ kc describe cm -n cilium-monitoring prometheus
# => prometheus.yaml:
#    ...
#    scrape_configs:
#      # https://github.com/prometheus/prometheus/blob/master/documentation/examples/prometheus-kubernetes.yml#L79
#      - job_name: 'kubernetes-endpoints'
#        kubernetes_sd_configs:
#          - role: endpoints
#        relabel_configs:
#          - source_labels: [__meta_kubernetes_pod_label_k8s_app]
#            action: keep
#            regex: cilium
#          - source_labels: [__meta_kubernetes_service_annotation_prometheus_io_scrape]
#            action: keep
#            regex: true
#          - source_labels: [__meta_kubernetes_service_annotation_prometheus_io_scheme]
#            action: replace
#            target_label: __scheme__
#            regex: (https?)
#          - source_labels: [__meta_kubernetes_service_annotation_prometheus_io_path]
#            action: replace
#            target_label: __metrics_path__
#            regex: (.+)
#          - source_labels: [__address__, __meta_kubernetes_service_annotation_prometheus_io_port]
#            action: replace
#            target_label: __address__
#            regex: (.+)(?::\d+);(\d+)
#            replacement: $1:$2
#          - action: labelmap
#            regex: __meta_kubernetes_service_label_(.+)
#          - source_labels: [__meta_kubernetes_namespace]
#            action: replace
#            target_label: namespace
#          - source_labels: [__meta_kubernetes_service_name]
#            action: replace
#            target_label: service
#    ...
Layer 7 Protocol Visibility
- Monitoring Datapath State는 기본적으로 L3/L4 패킷에 대한 가시성을 제공합니다.
- HTTP나 DNS같은 L7 프로토콜에 대한 가시성을 제공하기 위해서는 L7 프로토콜 가시성을 활성화해야 합니다.
- L7 트래픽에 대한 가시성을 활성화 하려면 L7 규칙을 지정하는 CiliumNetworkPolicy를 만들어야 합니다.
- CiliumNetworkPolicy는 L7 규칙과 일치하는 트래픽의 흐름이 Cilium에 표시되므로 최종사용자에게 노출될 수 있습니다.
- L7 네트워크 정책은 가시성을 가능하게 할 뿐만 아니라 pod에 들어가고 나가는 트래픽을 제어할 수 있음을 기억해야 합니다.
실습
- 다음 예제는 DNS(TCP/UDP/53) 및 HTTP(TCP/80 및 TCP/8080) 트래픽을 기본 네임스페이스 내에 표시할 수 있도록 L7 규칙을 지정합니다.
- 하나는 DNS 규칙과 하나는 HTTP 규칙을 제공하며, 한 출력 통신을 제외하고 일치하지 않는 모든것을 삭제합니다.
- 규칙이 L7 일치 조건이 생략되거나 와일드카드 처리되면 L4 섹션과 일치하는 모든 요청이 허용됩니다.
# 반복 접속 해둔 상태
$ kubectl exec -it curl-pod -- sh -c 'while true; do curl -s webpod | grep Hostname; sleep 1; done'

# default 네임스페이스에 있는 Pod들의 egress(출방향) 트래픽을 제어하며, L7 HTTP 및 DNS 트래픽에 대한 가시성과 제어를 설정
## method/path 기반 필터링은 안 하지만, HTTP 요청 정보는 Envoy를 통해 기록/관찰됨
## cilium-envoy를 경유하게 됨 (DNS + HTTP 모두 L7 처리 대상)
## 이 정책이 적용되면, 명시된 egress 외의 모든 egress 트래픽은 차단됩니다 (Cilium 정책은 default-deny 모델임)
$ cat <<EOF | kubectl apply -f -
apiVersion: "cilium.io/v2"
kind: CiliumNetworkPolicy
metadata:
  name: "l7-visibility"
spec:
  endpointSelector:
    matchLabels:
      "k8s:io.kubernetes.pod.namespace": default  # default 네임스페이스 안의 모든 Pod에 대해 egress 정책이 적용
  egress:
  - toPorts:
    - ports:
      - port: "53"
        protocol: ANY  # TCP, UDP 둘 다 허용
      rules:
        dns:
        - matchPattern: "*"  # 모든 도메인 조회 허용, L7 가시성 활성화
  - toEndpoints:
    - matchLabels:
        "k8s:io.kubernetes.pod.namespace": default
    toPorts:
    - ports:
      - port: "80"  # default 다른 파드의 HTTP TCP 80 요청 허용
        protocol: TCP
      - port: "8080"  # default 다른 파드의 HTTP TCP 8080 요청 허용
        protocol: TCP
      rules:
        http: [{}]  # 모든 HTTP 요청을 허용, L7 가시성 활성화
EOF

$ kubectl get cnp -o yaml
# =>   kind: CiliumNetworkPolicy
#      ...
#      spec:
#        egress:
#        - toPorts:
#          - ports:
#            - port: "53"
#              protocol: ANY
#            rules:
#              dns:
#              - matchPattern: '*'
#        - toEndpoints:
#          - matchLabels:
#              k8s:io.kubernetes.pod.namespace: default
#          toPorts:
#          - ports:
#            - port: "80"
#              protocol: TCP
#            - port: "8080"
#              protocol: TCP
#            rules:
#              http:
#              - {}
#        endpointSelector:
#          matchLabels:
#            k8s:io.kubernetes.pod.namespace: default
#      ...

# 호출 확인 : cilium-envoy 경유 확인
$ kubectl exec -it curl-pod -- curl -s webpod
# => Hostname: webpod-697b545f57-mvz92
#    IP: 127.0.0.1
#    IP: ::1
#    IP: 172.20.2.101
#    IP: fe80::68c6:baff:fe2c:766b
#    <span style="color: green;">RemoteAddr: 172.20.0.43:39216</span> # 해당 IP는 curl-pod 의 IP로 cilium-envoy IP로 SNAT 되지 않았음!
#    GET / HTTP/1.1
#    Host: webpod
#    User-Agent: curl/8.14.1
#    Accept: */*
#    <span style="color: green;">X-Envoy-Expected-Rq-Timeout-Ms: 3600000</span>   # cilium-envoy 경유 확인
#    <span style="color: green;">X-Envoy-Internal: true</span>
#    X-Forwarded-Proto: http
#    X-Request-Id: 913dbacf-5559-4d13-8855-afaa41979f4e

# 가시성 확인
$ hubble observe -f -t l7 -o compact
# => Jul 26 14:58:47.953: default/curl-pod:34773 (ID:472) -> kube-system/coredns-674b8bbfcf-7m82r:53 (ID:30923) dns-request proxy FORWARDED (DNS Query webpod.default.svc.cluster.local. AAAA)
#    Jul 26 14:58:47.953: default/curl-pod:34773 (ID:472) -> kube-system/coredns-674b8bbfcf-7m82r:53 (ID:30923) dns-request proxy FORWARDED (DNS Query webpod.default.svc.cluster.local. A)
#    Jul 26 14:58:47.954: default/curl-pod:34773 (ID:472) <- kube-system/coredns-674b8bbfcf-7m82r:53 (ID:30923) dns-response proxy FORWARDED (DNS Answer "10.96.147.79" TTL: 30 (Proxy webpod.default.svc.cluster.local. A))
#    Jul 26 14:58:47.956: default/curl-pod:34773 (ID:472) <- kube-system/coredns-674b8bbfcf-7m82r:53 (ID:30923) dns-response proxy FORWARDED (DNS Answer  TTL: 4294967295 (Proxy webpod.default.svc.cluster.local. AAAA))
#    Jul 26 14:58:47.961: default/curl-pod:52022 (ID:472) -> default/webpod-697b545f57-mvz92:80 (ID:18655) http-request FORWARDED (HTTP/1.1 GET http://webpod/)
#    Jul 26 14:58:47.967: default/curl-pod:52022 (ID:472) <- default/webpod-697b545f57-mvz92:80 (ID:18655) http-response FORWARDED (HTTP/1.1 200 5ms (GET http://webpod/))
#    ...
- Grafana에서 L7 HTTP Metrics by Workload 대시보드를 확인해보면, HTTP 요청 및 응답에 대한 메트릭을 확인할 수 있습니다.
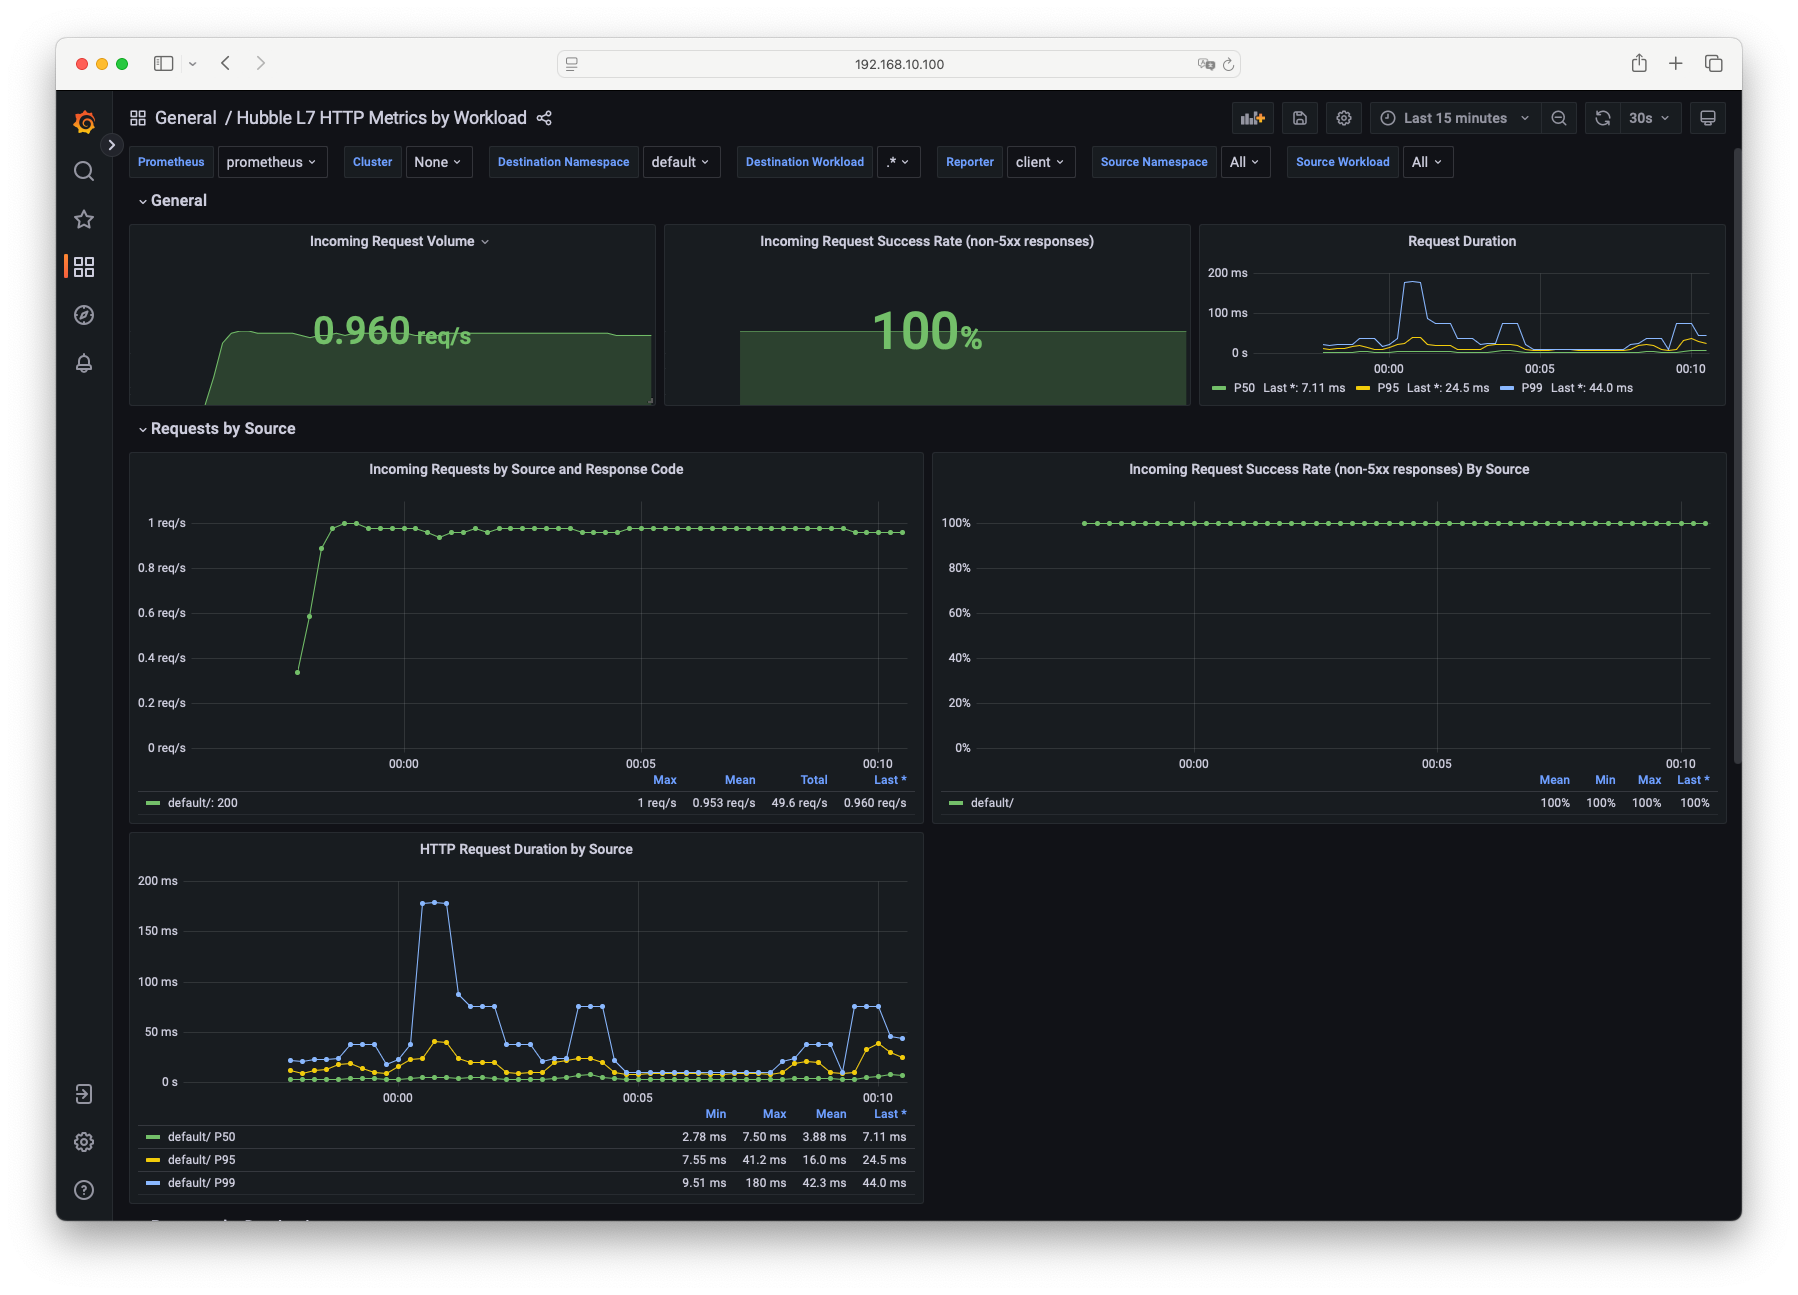
- 이때 현재 label에는 destination_workload가 포함되어있지 않아서 메트릭이 나타나지 않는데 Destination Workload를 임시로
.*(정규표현식에서 와일드 카드)로 하거나 PromQL에서 해당 부분을 제외하거나 label에 추가하면 메트릭을 확인할 수 있습니다.
- 이때 현재 label에는 destination_workload가 포함되어있지 않아서 메트릭이 나타나지 않는데 Destination Workload를 임시로
- Prometheus에서도
rate(hubble_http_requests_total[5m])를 통해 확인해 보겠습니다.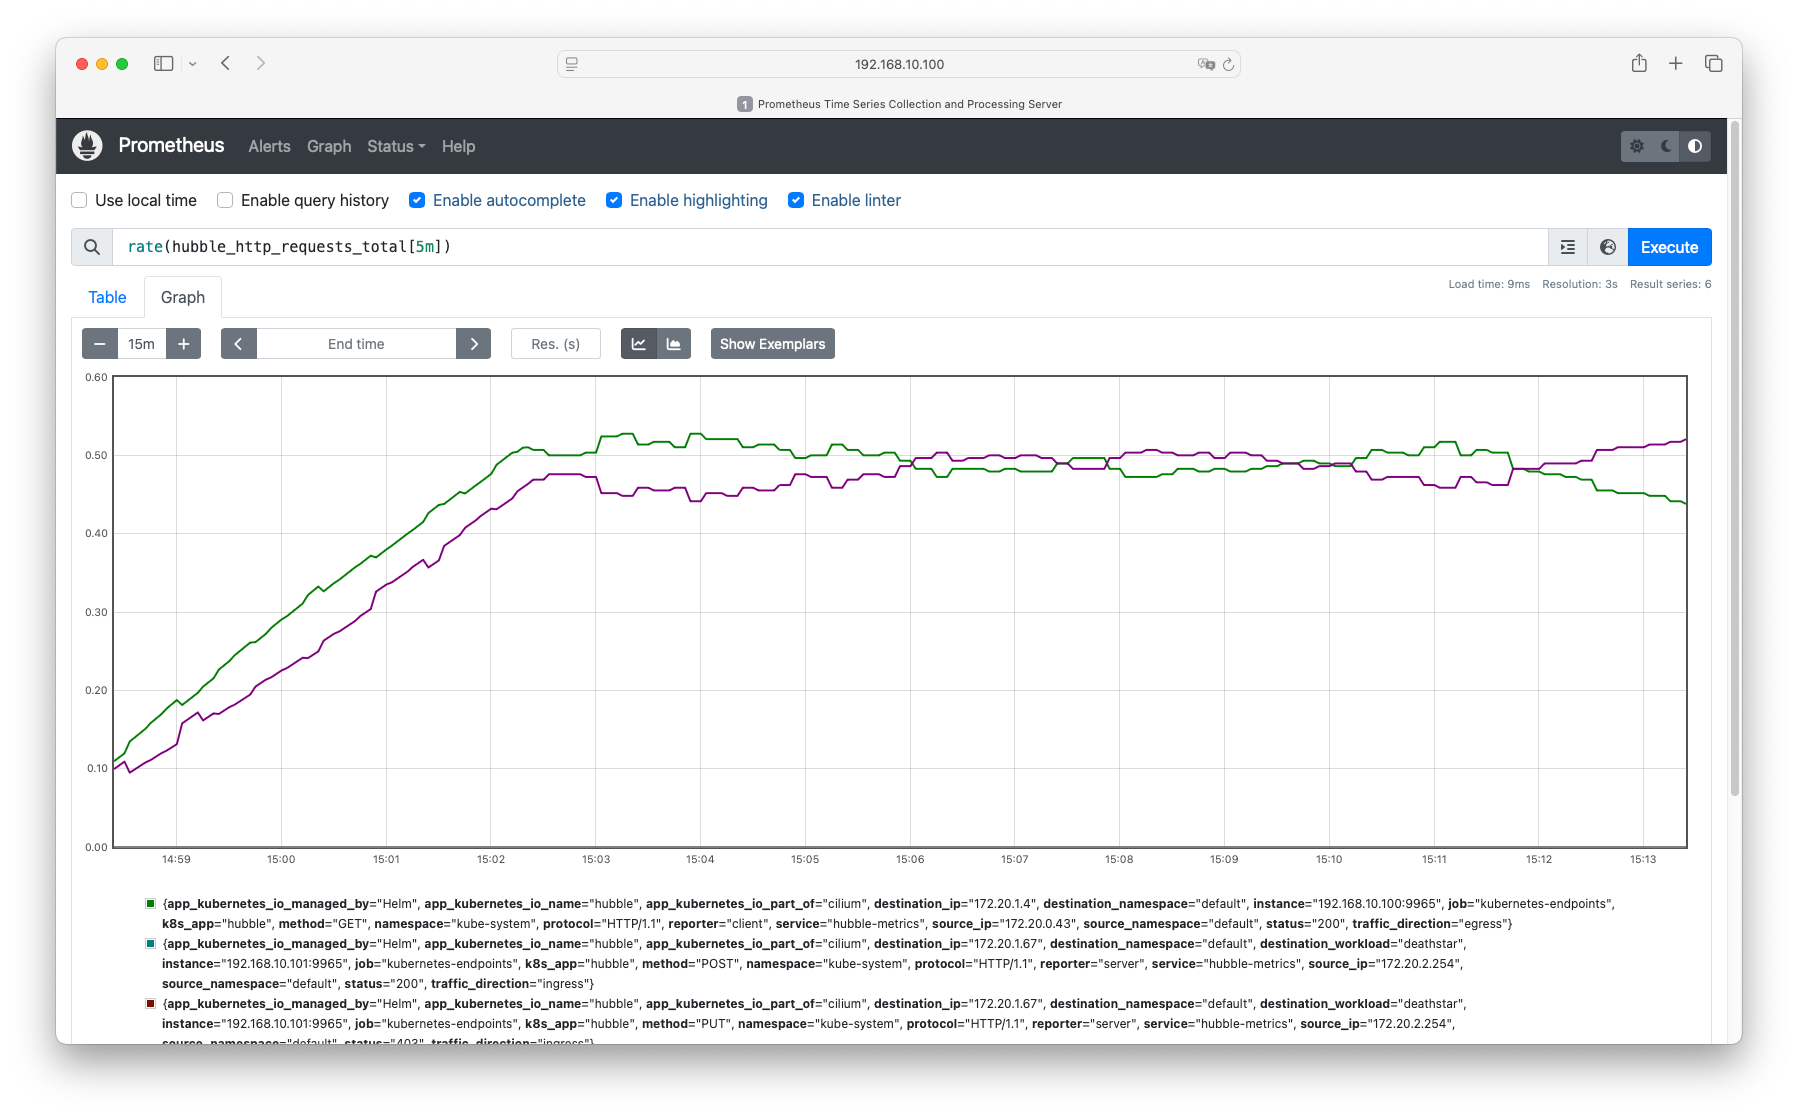
Security Implications 및 실습
- L7 트래픽 모니터링은 사용자 이름, 비밀번호, 쿼리 매개변수, API 키 등 잠재적으로 민감한 정보를 포함할 수 있기 때문에 보안에 주의해야 합니다.
- 기본적으로 Hubble은 L7 트래픽의 민감 정보를 필터링하지 않습니다.
- 간단한 실습을 해보겠습니다.
# $ hubble observe -f -t l7 # => Jul 26 15:50:11.494: default/curl-pod:49308 (ID:472) -> default/webpod-697b545f57-mvz92:80 (ID:18655) http-request FORWARDED (HTTP/1.1 GET http://webpod/?user_id=1234) # Jul 26 15:50:11.499: default/curl-pod:49308 (ID:472) <- default/webpod-697b545f57-mvz92:80 (ID:18655) http-response FORWARDED (HTTP/1.1 200 5ms (GET http://webpod/?user_id=1234)) # <span style="color: green;">👉 아래의 curl 명령으로 보낸 user_id가 그대로 보이는것을 확인할 수 있습니다.</span> # $ kubectl exec -it curl-pod -- sh -c 'curl -s webpod/?user_id=1234' # 민감정보 미출력 설정 $ helm upgrade cilium cilium/cilium --namespace kube-system --reuse-values \ --set extraArgs="{--hubble-redact-enabled,--hubble-redact-http-urlquery}" # => Release "cilium" has been upgraded. Happy Helming! # NAME: cilium # LAST DEPLOYED: Sun Jul 27 00:51:08 2025 # NAMESPACE: kube-system # STATUS: deployed # REVISION: 10 # TEST SUITE: None # NOTES: # You have successfully installed Cilium with Hubble Relay and Hubble UI. # # Your release version is 1.17.6. # $ kubectl exec -it curl-pod -- sh -c 'curl -s webpod/?user_id=1234' # $ hubble observe -f -t l7 # => Jul 26 15:51:49.594: default/curl-pod:53276 (ID:472) -> default/webpod-697b545f57-ns4sw:80 (ID:18655) http-request FORWARDED (HTTP/1.1 GET http://webpod/) # Jul 26 15:51:49.601: default/curl-pod:53276 (ID:472) <- default/webpod-697b545f57-ns4sw:80 (ID:18655) http-response FORWARDED (HTTP/1.1 200 9ms (GET http://webpod/)) # <span style="color: green;">👉 민감정보가 필터링 된것을 확인할 수 있습니다.</span> - 보안을 강화하기 위해 Cilium은 허블이 레이어 7 흐름에 존재하는 민감한 정보를 처리(제거나 마스킹)할 수 있도록
--hubble-redact-enabled옵션을 제공합니다.- HTTP에서 URL 쿼리 파라메터(GET)을 필터링 하기위해
--hubble-redact-http-urlquery를 사용 => URL의?query=value제거- 예시) 설정 전
"method": "GET", "url": "/user/profile?user_id=1234&token=abcd1234", "status": 200 - 예시) 설정 후 :
--set extraArgs="{--hubble-redact-http-urlquery}”"method": "GET", "url": "/user/profile", # 쿼리 문자열이 제거되어 출력, 민감 정보 보호됨 "status": 200
- 예시) 설정 전
- HTTP에서 사용자정보 (basic auth의 아이디 비밀번호) 등을 필터링하기위해
--hubble-redact-http-userinfo를 사용 => URL의user:pass@제거 - Kafka에서 API 키를 필터링하려면
--hubble-redact-kafka-apikey사용 - HTTP 헤더를 필터링하기 위해서는 허용리스트(
--hubble-redact-http-headers-allow) 또는 거부리스트 (--hubble-redact-http-headers-deny)를 사용
- HTTP에서 URL 쿼리 파라메터(GET)을 필터링 하기위해
pwru (Packet where are you)
- pwru는 eBPF 기반의 linux 커널 디버거입니다. https://github.com/cilium/pwru
- 주요 특징
- eBPF 기반 네트워크 트레이싱 툴로, 커널 패킷 경로를 실시간으로 모니터링합니다.
- 고급 필터링 기능을 제공하여, 관심 있는 패킷만 골라서 추적할 수 있습니다
- 네트워크 트러블슈팅, 즉 패킷 손실 및 처리 위치 파악, 다양한 커널 모듈과의 상호작용 등을 이해하는 데 유용합니다.
- 커맨드라인에서 다양한 옵션과 PCAP 필터를 적용해서 상세 분석을 할 수 있습니다.
pwru 설치 및 실행
- PWRU: Debugging Packets and Kernel Flows를 바탕으로 실행해보겠습니다.
# Prerequisites
$ sudo apt update
$ sudo apt install -y clang llvm gcc make flex bison byacc yacc libpcap-dev golang

# Building PWRU from Source
## Clone the PWRU GitHub repository
$ git clone https://github.com/cilium/pwru.git
# => Cloning into 'pwru'...
#    remote: Enumerating objects: 7681, done.
#    remote: Counting objects: 100% (211/211), done.
#    remote: Compressing objects: 100% (127/127), done.
#    remote: Total 7681 (delta 117), reused 94 (delta 83), pack-reused 7470 (from 3)
#    Receiving objects: 100% (7681/7681), 9.40 MiB | 18.12 MiB/s, done.
#    Resolving deltas: 100% (4723/4723), done.

## Navigate to the project directory
$ cd pwru

## Build the project : Compile the eBPF object files, Build the userspace Go application, Link everything together
$ make
# => ...
#    TARGET_GOARCH=<span style="color: green;">amd64</span> go generate
#    Generating for <span style="color: green;">amd64</span>
#    CC=cc GOARCH=<span style="color: green;">amd64</span> CGO_ENABLED=1 go build  \
#            -ldflags "-w -s \
#            -X 'github.com/cilium/pwru/internal/pwru.Version=v1.0.10-pre-110-gbd7ffd8'"
#    # runtime/cgo
#    <span style="background-color: red; color: #fff;">cc: error: unrecognized command-line option '-m64'</span>
#    make: *** [Makefile:22: pwru] Error 1
- M1 Mac에서 빌드할 때는
-m64옵션이 문제를 일으키는것 같습니다.
빌드 트러블슈팅 및 실행
- 빌드 로그를 봤을때 자꾸 amd64로 빌드하려고 하는것 같습니다.
$ uname -a
# => Linux k8s-ctr 6.8.0-53-generic #55-Ubuntu SMP PREEMPT_DYNAMIC Fri Jan 17 15:02:14 UTC 2025 <span style="color: green;">aarch64 aarch64 aarch64</span> GNU/Linux
- 하지만 제 환경은 aarch64으로 뭔기 빌드 설정이 잘못된것 같습니다. 빌드 스크립트를 수정하고 PR을 올리면 좋겠지만 시간이 없으므로 arm64로 강제로 빌드해보겠습니다.
# (기존) TARGET_GOARCH=amd64 go generate
$ TARGET_GOARCH=arm64 go generate
# => Generating for arm64

# (기존) CC=cc GOARCH=amd64 CGO_ENABLED=1 go build  \
#         -ldflags "-w -s \
#         -X 'github.com/cilium/pwru/internal/pwru.Version=v1.0.10-pre-110-gbd7ffd8'"
$ CC=cc GOARCH=arm64 CGO_ENABLED=1 go build  \
        -ldflags "-w -s \
        -X 'github.com/cilium/pwru/internal/pwru.Version=v1.0.10-pre-110-gbd7ffd8'"
# => # github.com/cilium/pwru
#    /usr/bin/ld: /tmp/go-link-4205941405/000020.o: in function `_cgo_77133bf98b3a_C2func_getaddrinfo':
#    /tmp/go-build/cgo_unix_cgo.cgo2.c:60:(.text+0x30): warning: Using 'getaddrinfo' in statically linked applications requires at runtime the shared libraries from the glibc version used for linking
#    /usr/bin/ld: /root/pwru/internal/libpcap/../../libpcap/libpcap.a(nametoaddr.o): in function `pcap_nametoaddr':
#    /root/pwru/libpcap/./nametoaddr.c:181:(.text+0x8): warning: Using 'gethostbyname' in statically linked applications requires at runtime the shared libraries from the glibc version used for linking
#    /usr/bin/ld: /root/pwru/internal/libpcap/../../libpcap/libpcap.a(nametoaddr.o): in function `pcap_nametonetaddr':
#    /root/pwru/libpcap/./nametoaddr.c:270:(.text+0x104): warning: Using 'getnetbyname_r' in statically linked applications requires at runtime the shared libraries from the glibc version used for linking
#    /usr/bin/ld: /root/pwru/internal/libpcap/../../libpcap/libpcap.a(nametoaddr.o): in function `pcap_nametoproto':
#    /root/pwru/libpcap/./nametoaddr.c:527:(.text+0x4cc): warning: Using 'getprotobyname_r' in statically linked applications requires at runtime the shared libraries from the glibc version used for linking
# <span style="color: green;">👉 warning이 뜨긴 했지만 빌드가 된것 같습니다.</span>

$ ls -l pwru
# => -rwxr-xr-x 1 root root 8561904 Jul 27 00:39 pwru
- 빌드가 완료되면
pwru실행파일이 생성됩니다. 이 파일을 실행하면 PWRU를 사용할 수 있습니다. - 리눅스 커널과 eBPF 서브시스템에 직접 상호작용하기 때문에 root 권한으로 실행해야 합니다.
# Running PWRU
## Since PWRU interacts directly with kernel functions and eBPF subsystems, you need root permissions to run it:
$ sudo ./pwru [options] [pcap-filter]

# ICMP (ping) 패킷을 추적해보겠습니다.
$ sudo ./pwru --output-tuple icmp
# => 2025/07/27 00:40:49 Attaching kprobes (via kprobe)...
#    1669 / 1669 [--------------------------------------------------------] 100.00% 1455 p/s
#    2025/07/27 00:40:50 Attached (ignored 5)
#    2025/07/27 00:40:50 Listening for events..  # <span style="color: green;">👉 eBPF 설치하는 과정이 종료되고 이벤트를 listening 하고 있습니다.</span>
#    SKB                CPU PROCESS          NETNS      MARK/x        IFACE       PROTO  MTU   LEN   TUPLE FUNC
#    0xffff00005f10c300 0   ~/bin/ping:42701 4026531840 0               0         0x0000 1500  84    10.0.2.15:0->8.8.8.8:0(icmp)     ip_send_skb
#    0xffff00005f10c300 0   ~/bin/ping:42701 4026531840 0               0         0x0000 1500  84    10.0.2.15:0->8.8.8.8:0(icmp)     __ip_local_out
#    0xffff00005f10c300 0   ~/bin/ping:42701 4026531840 0               0         0x0800 1500  84    10.0.2.15:0->8.8.8.8:0(icmp)     nf_hook_slow
#    0xffff00005f10c300 0   ~/bin/ping:42701 4026531840 c00             0         0x0800 1500  84    10.0.2.15:0->8.8.8.8:0(icmp)     ip_output
#    0xffff00005f10c300 0   ~/bin/ping:42701 4026531840 c00           eth0:2      0x0800 1500  84    10.0.2.15:0->8.8.8.8:0(icmp)     nf_hook_slow
#    0xffff00005f10c300 0   ~/bin/ping:42701 4026531840 c00           eth0:2      0x0800 1500  84    10.0.2.15:0->8.8.8.8:0(icmp)     apparmor_ip_postroute
#    0xffff00005f10c300 0   ~/bin/ping:42701 4026531840 c00           eth0:2      0x0800 1500  84    10.0.2.15:0->8.8.8.8:0(icmp)     ip_finish_output
#    0xffff00005f10c300 0   ~/bin/ping:42701 4026531840 c00           eth0:2      0x0800 1500  84    10.0.2.15:0->8.8.8.8:0(icmp)     __ip_finish_output
#    0xffff00005f10c300 0   ~/bin/ping:42701 4026531840 c00           eth0:2      0x0800 1500  84    10.0.2.15:0->8.8.8.8:0(icmp)     ip_finish_output2
#    0xffff00005f10c300 0   ~/bin/ping:42701 4026531840 c00           eth0:2      0x0800 1500  98    10.0.2.15:0->8.8.8.8:0(icmp)     __dev_queue_xmit
#    0xffff00005f10c300 0   ~/bin/ping:42701 4026531840 c00           eth0:2      0x0800 1500  98    10.0.2.15:0->8.8.8.8:0(icmp)     qdisc_pkt_len_init
#    0xffff00005f10c300 0   ~/bin/ping:42701 4026531840 300           eth0:2      0x0800 1500  98    10.0.2.15:0->8.8.8.8:0(icmp)     netdev_core_pick_tx
#    0xffff00005f10c300 0   ~/bin/ping:42701 4026531840 300           eth0:2      0x0800 1500  98    10.0.2.15:0->8.8.8.8:0(icmp)     dev_qdisc_enqueue
#    0xffff00005f10c300 0   ~/bin/ping:42701 4026531840 300           eth0:2      0x0800 1500  98    10.0.2.15:0->8.8.8.8:0(icmp)     __skb_get_hash
#    0xffff00005f10c300 1   ~/sbin/sshd:6275 4026531840 300           eth0:2      0x0800 1500  98    10.0.2.15:0->8.8.8.8:0(icmp)     sch_direct_xmit
#    0xffff00005f10c300 1   ~/sbin/sshd:6275 4026531840 300           eth0:2      0x0800 1500  98    10.0.2.15:0->8.8.8.8:0(icmp)     validate_xmit_skb_list
#    0xffff00005f10c300 1   ~/sbin/sshd:6275 4026531840 300           eth0:2      0x0800 1500  98    10.0.2.15:0->8.8.8.8:0(icmp)     validate_xmit_skb
#    0xffff00005f10c300 1   ~/sbin/sshd:6275 4026531840 300           eth0:2      0x0800 1500  98    10.0.2.15:0->8.8.8.8:0(icmp)     netif_skb_features
#    0xffff00005f10c300 1   ~/sbin/sshd:6275 4026531840 300           eth0:2      0x0800 1500  98    10.0.2.15:0->8.8.8.8:0(icmp)     skb_network_protocol
#    0xffff00005f10c300 1   ~/sbin/sshd:6275 4026531840 300           eth0:2      0x0800 1500  98    10.0.2.15:0->8.8.8.8:0(icmp)     validate_xmit_xfrm
#    0xffff00005f10c300 1   ~/sbin/sshd:6275 4026531840 300           eth0:2      0x0800 1500  98    10.0.2.15:0->8.8.8.8:0(icmp)     dev_hard_start_xmit
#    0xffff00005f10c300 1   ~/sbin/sshd:6275 4026531840 300           eth0:2      0x0800 1500  98    10.0.2.15:0->8.8.8.8:0(icmp)     skb_clone_tx_timestamp
#    0xffff00005f10c300 1   ~/sbin/sshd:6275 4026531840 300           eth0:2      0x0800 1500  98    10.0.2.15:0->8.8.8.8:0(icmp)     napi_consume_skb
#    0xffff00005f10c300 1   ~/sbin/sshd:6275 4026531840 300           eth0:2      0x0800 1500  98    10.0.2.15:0->8.8.8.8:0(icmp)     skb_release_head_state
#    0xffff00005f10c300 1   ~/sbin/sshd:6275 4026531840 300           eth0:2      0x0800 1500  98    10.0.2.15:0->8.8.8.8:0(icmp)     sock_wfree
#    0xffff00005f10c300 1   ~/sbin/sshd:6275 4026531840 300           eth0:2      0x0800 1500  98    10.0.2.15:0->8.8.8.8:0(icmp)     skb_release_data
#    0xffff00005f10c300 1   ~/sbin/sshd:6275 4026531840 300           eth0:2      0x0800 1500  98    10.0.2.15:0->8.8.8.8:0(icmp)     skb_free_head
#    0xffff00005f10c300 1   ~/sbin/sshd:6275 4026531840 300           eth0:2      0x0800 1500  98    10.0.2.15:0->8.8.8.8:0(icmp)     napi_skb_cache_put
#    0xffff000007add600 0   <empty>:0        4026531840 0             eth0:2      0x0800 1500  84    8.8.8.8:0->10.0.2.15:0(icmp)     inet_gro_receive
#    0xffff000007add600 0   <empty>:0        4026531840 0             eth0:2      0x0800 1500  84    8.8.8.8:0->10.0.2.15:0(icmp)     skb_defer_rx_timestamp
#    0xffff000007add600 0   <empty>:0        4026531840 0             eth0:2      0x0800 1500  98    8.8.8.8:0->10.0.2.15:0(icmp)     skb_ensure_writable
#    0xffff000007add600 0   <empty>:0        4026531840 300           eth0:2      0x0800 1500  84    8.8.8.8:0->10.0.2.15:0(icmp)     ip_rcv_core
#    0xffff000007add600 0   <empty>:0        4026531840 300           eth0:2      0x0800 1500  84    8.8.8.8:0->10.0.2.15:0(icmp)     nf_hook_slow
#    0xffff000007add600 0   <empty>:0        4026531840 300           eth0:2      0x0800 1500  84    8.8.8.8:0->10.0.2.15:0(icmp)     nf_ip_checksum
#    0xffff000007add600 0   <empty>:0        4026531840 300           eth0:2      0x0800 1500  84    8.8.8.8:0->10.0.2.15:0(icmp)     __skb_checksum_complete
#    0xffff000007add600 0   <empty>:0        4026531840 300           eth0:2      0x0800 1500  84    8.8.8.8:0->10.0.2.15:0(icmp)     ip_route_input_noref
#    0xffff000007add600 0   <empty>:0        4026531840 300           eth0:2      0x0800 1500  84    8.8.8.8:0->10.0.2.15:0(icmp)     ip_route_input_slow
#    0xffff000007add600 0   <empty>:0        4026531840 300           eth0:2      0x0800 1500  84    8.8.8.8:0->10.0.2.15:0(icmp)     fib_validate_source
#    0xffff000007add600 0   <empty>:0        4026531840 300           eth0:2      0x0800 1500  84    8.8.8.8:0->10.0.2.15:0(icmp)     __fib_validate_source
#    0xffff000007add600 0   <empty>:0        4026531840 300           eth0:2      0x0800 65536 84    8.8.8.8:0->10.0.2.15:0(icmp)     ip_local_deliver
#    0xffff000007add600 0   <empty>:0        4026531840 300           eth0:2      0x0800 65536 84    8.8.8.8:0->10.0.2.15:0(icmp)     nf_hook_slow
#    0xffff000007add600 0   <empty>:0        4026531840 300           eth0:2      0x0800 65536 84    8.8.8.8:0->10.0.2.15:0(icmp)     ip_local_deliver_finish
#    0xffff000007add600 0   <empty>:0        4026531840 300           eth0:2      0x0800 65536 64    8.8.8.8:0->10.0.2.15:0(icmp)     ip_protocol_deliver_rcu
#    0xffff000007add600 0   <empty>:0        4026531840 300           eth0:2      0x0800 65536 64    8.8.8.8:0->10.0.2.15:0(icmp)     raw_local_deliver
#    0xffff000007add600 0   <empty>:0        4026531840 300           eth0:2      0x0800 65536 64    8.8.8.8:0->10.0.2.15:0(icmp)     raw_v4_input
#    0xffff000007add600 0   <empty>:0        4026531840 300           eth0:2      0x0800 65536 64    8.8.8.8:0->10.0.2.15:0(icmp)     skb_clone
#    0xffff00005f10c400 0   <empty>:0        4026531840 300           eth0:2      0x0800 65536 64    8.8.8.8:0->10.0.2.15:0(icmp)     raw_rcv
#    0xffff00005f10c400 0   <empty>:0        4026531840 300           eth0:2      0x0800 65536 64    8.8.8.8:0->10.0.2.15:0(icmp)     skb_push
#    0xffff00005f10c400 0   <empty>:0        4026531840 300           eth0:2      0x0800 65536 84    8.8.8.8:0->10.0.2.15:0(icmp)     ipv4_pktinfo_prepare
#    0xffff00005f10c400 0   <empty>:0        4026531840 300           eth0:2      0x0800 1500  84    8.8.8.8:0->10.0.2.15:0(icmp)     sock_queue_rcv_skb_reason
#    0xffff00005f10c400 0   <empty>:0        4026531840 300           eth0:2      0x0800 1500  84    8.8.8.8:0->10.0.2.15:0(icmp)     sk_filter_trim_cap
#    0xffff00005f10c400 0   <empty>:0        4026531840 300           eth0:2      0x0800 1500  84    8.8.8.8:0->10.0.2.15:0(icmp)     security_sock_rcv_skb
#    0xffff00005f10c400 0   <empty>:0        4026531840 300           eth0:2      0x0800 1500  84    8.8.8.8:0->10.0.2.15:0(icmp)     apparmor_socket_sock_rcv_skb
#    0xffff00005f10c400 0   <empty>:0        4026531840 300           eth0:2      0x0800 1500  84    8.8.8.8:0->10.0.2.15:0(icmp)     __sock_queue_rcv_skb
#    0xffff000007add600 0   <empty>:0        4026531840 300           eth0:2      0x0800 65536 64    8.8.8.8:0->10.0.2.15:0(icmp)     icmp_rcv
#    0xffff000007add600 0   <empty>:0        4026531840 300           eth0:2      0x0800 65536 56    8.8.8.8:0->10.0.2.15:0(icmp)     ping_rcv
#    0xffff000007add600 0   <empty>:0        4026531840 300           eth0:2      0x0800 65536 56    8.8.8.8:0->10.0.2.15:0(icmp)     skb_push
#    0xffff000007add600 0   <empty>:0        4026531840 300           eth0:2      0x0800 65536 64    8.8.8.8:0->10.0.2.15:0(icmp)     kfree_skb_reason(SKB_DROP_REASON_NO_SOCKET)
#    0xffff000007add600 0   <empty>:0        4026531840 300           eth0:2      0x0800 65536 64    8.8.8.8:0->10.0.2.15:0(icmp)     skb_release_head_state
#    0xffff000007add600 0   <empty>:0        4026531840 300           eth0:2      0x0800 1500  64    8.8.8.8:0->10.0.2.15:0(icmp)     skb_release_data
#    0xffff000007add600 0   <empty>:0        4026531840 300           eth0:2      0x0800 1500  64    8.8.8.8:0->10.0.2.15:0(icmp)     kfree_skbmem
#    0xffff00005f10c400 1   <empty>:42701    4026531840 300             0         0x0800 0     84    8.8.8.8:0->10.0.2.15:0(icmp)     __sock_recv_cmsgs
#    0xffff00005f10c400 1   <empty>:42701    4026531840 300             0         0x0800 0     84    8.8.8.8:0->10.0.2.15:0(icmp)     __sock_recv_timestamp
#    0xffff00005f10c400 1   <empty>:42701    4026531840 300             0         0x0800 0     84    8.8.8.8:0->10.0.2.15:0(icmp)     skb_free_datagram
#    0xffff00005f10c400 1   <empty>:42701    4026531840 300             0         0x0800 0     84    8.8.8.8:0->10.0.2.15:0(icmp)     consume_skb
#    0xffff00005f10c400 1   <empty>:42701    4026531840 300             0         0x0800 0     84    8.8.8.8:0->10.0.2.15:0(icmp)     skb_release_head_state
#    0xffff00005f10c400 1   <empty>:42701    4026531840 300             0         0x0800 0     84    8.8.8.8:0->10.0.2.15:0(icmp)     sock_rfree
#    0xffff00005f10c400 1   <empty>:42701    4026531840 300             0         0x0800 0     84    8.8.8.8:0->10.0.2.15:0(icmp)     skb_release_data
#    0xffff00005f10c400 1   <empty>:42701    4026531840 300             0         0x0800 0     84    8.8.8.8:0->10.0.2.15:0(icmp)     skb_free_head
#    0xffff00005f10c400 1   <empty>:42701    4026531840 300             0         0x0800 0     84    8.8.8.8:0->10.0.2.15:0(icmp)     kfree_skbmem

# 다른 터미널에서 ping 명령어를 실행해보겠습니다.
$ ping -c 1 8.8.8.8
# => PING 8.8.8.8 (8.8.8.8) 56(84) bytes of data.
#    64 bytes from 8.8.8.8: icmp_seq=1 ttl=255 time=38.7 ms
#
#    --- 8.8.8.8 ping statistics ---
#    1 packets transmitted, 1 received, 0% packet loss, time 0ms
#    rtt min/avg/max/mdev = 38.740/38.740/38.740/0.000 ms
- ping 한번 보냈을 뿐인데 엄청난 량의 정보가 나왔습니다. 자세한 자료는 아래의 참고 자료를 참고해보시기 바랍니다.
- 참고 자료
마치며
이번 포스트에서는 Cilium의 관측성(Observability)을 위한 Hubble과 Prometheus/Grafana 연동, 각종 메트릭 그리고 PWRU를 설치하고 사용해보았습니다. 굉장히 많은 정보량에 압도되었습니다. 그래도 차근차근 따라가면서 실습해보니 Cilium의 관측성 기능을 이해하는데 큰 도움이 되었습니다.
관측성 도구들은 정말 강력하고 유용한 기능이지만 민감한 정보가 노출될 수 있기 때문에, 프로덕션 환경에서는 주의해서 사용해야 할 것 같습니다. 특히 끊임없이 새로운 기술이 나오고, 새로운 툴들이 나오고, 쉽게 설치하고 버전을 바꾸고 하는 현실에서 사소한 설정하나로 정보 유출이 발생할 수 있다는 점이 무섭기도 합니다. 개발환경이나 내부에서 충분히 테스트하고 검증한 후에 프로덕션 환경에 적용하는 것이 중요할 것 같습니다.
이제 조금씩 회사 업무에도 Cilium을 적용하고 있어서 이번에 학습한 관측성 기능들을 활용해서
Cilium을 더 잘 이해하고, 문제를 해결하는데 도움이 될 것 같습니다.
이번 주도 스터디 준비해주신 모든 분들께 감사드립니다. ![]()